
Using climate data to understand the greenhouse gas emissions reporting landscape
Published
May 20, 2022
Authors


Regulatory Products
ESG, SFDR PAI, SRI, SLB, GHG: the list of sustainable finance abbreviations seems to be sprouting as fast as the amount of money flowing into these products. In 2021, global impact bond issuance soared past $1 trillion and assets under management for US sustainable funds hit $357 billion, with a climate-focused ETF netting over one billion on first day of launch during the year, a new record on both fronts for sustainable funds. These investment managers are guided by climate data that can be used alongside traditional valuation metrics to help refine investment strategy.
In March, the SEC proposed several additional climate-related disclosures for investors. The proposal is designed to improve transparency and comparability of climate risk disclosures. All filers will be required to disclose Scope 1 and Scope 2 emissions, while only larger companies would be required to disclose Scope 3 emissions if material or the company includes Scope 3 emissions in its GHG reduction targets.
Using ICE ESG Data, we examined GHG emissions disclosure across a sampling of equity benchmarks on both sides of the Atlantic. The sampling showed that European indices tended to have a higher percentage of their constituent companies providing emissions disclosures. At the country level, France and Germany topped the leaderboard, with their indices having average disclosure at or above 90% of constituent companies. This pattern appears to be driven by the Non-Financial Reporting Directive (NFRD) which covers French and German firms, making it more likely for them to be required to disclose.
Index Constituent GHG Emissions Disclosure
Proportion of Index Constituent Companies Currently Disclosing
Source: ICE Data Services
Digging deeper into the data, we looked at the ICE US 1000 Index and tried to determine if there were patterns in GHG emissions disclosure at the sector level. To do this, we combined reference data from ICE’s Business Entity service with information from ICE’s Sustainable Finance Data. Interestingly, there was some significant disparity among the sectors, despite all companies being domiciled in the United States and being constituents of the same index. At one end of the spectrum, companies classified by ICE in the Utilities sector showed an impressive proportion disclosing GHG emissions, with Scope 1 and 2 hovering on either side of 95% and Scope 3 just north of 80%. By contrast, Healthcare companies, as a group, were not able to muster a reading above 50% disclosure for any of the three emissions categories.
ICE US 1000 Index GHG Emissions Disclosure by Sector
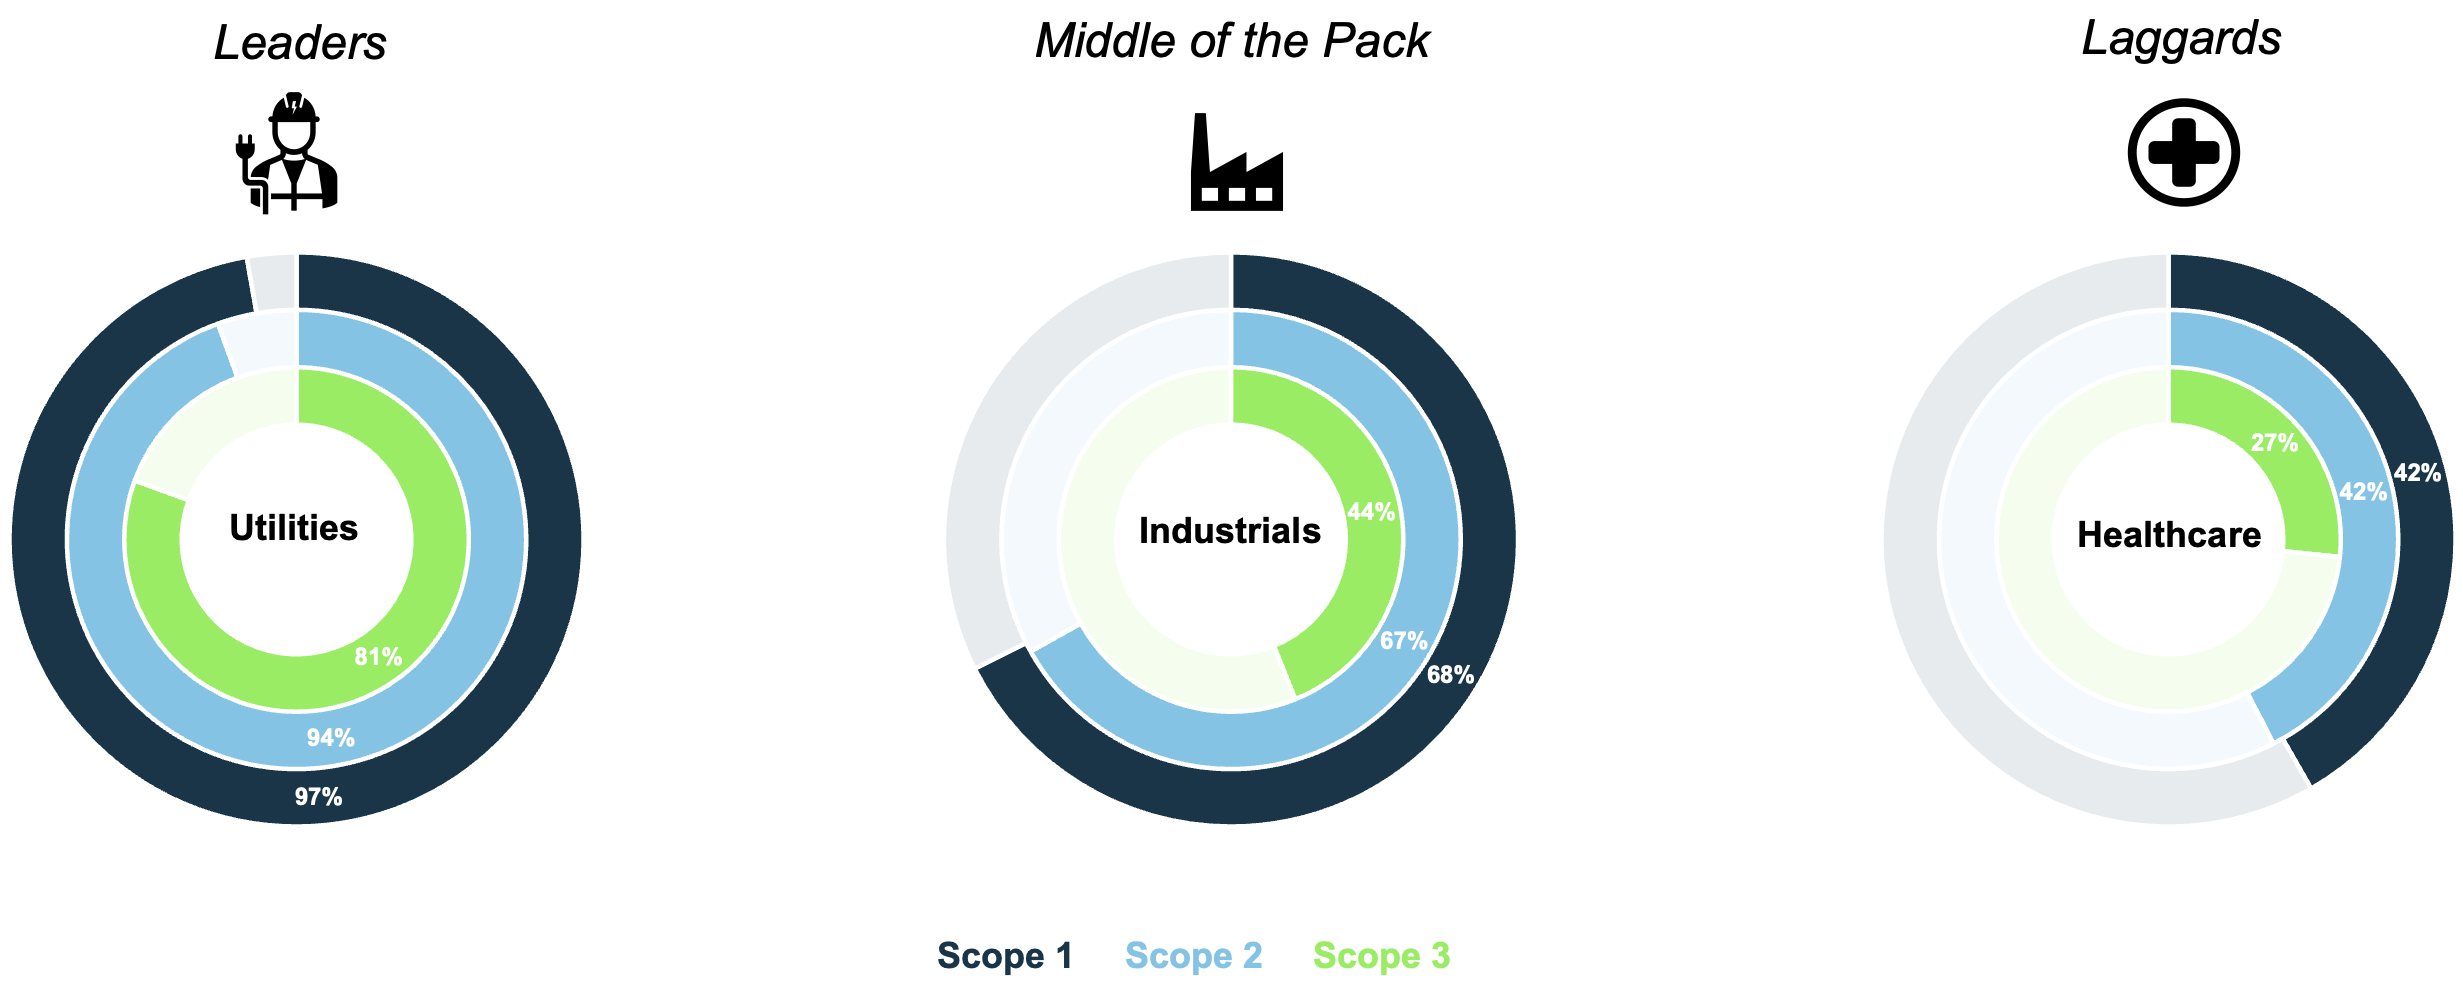
Source: ICE Data Services
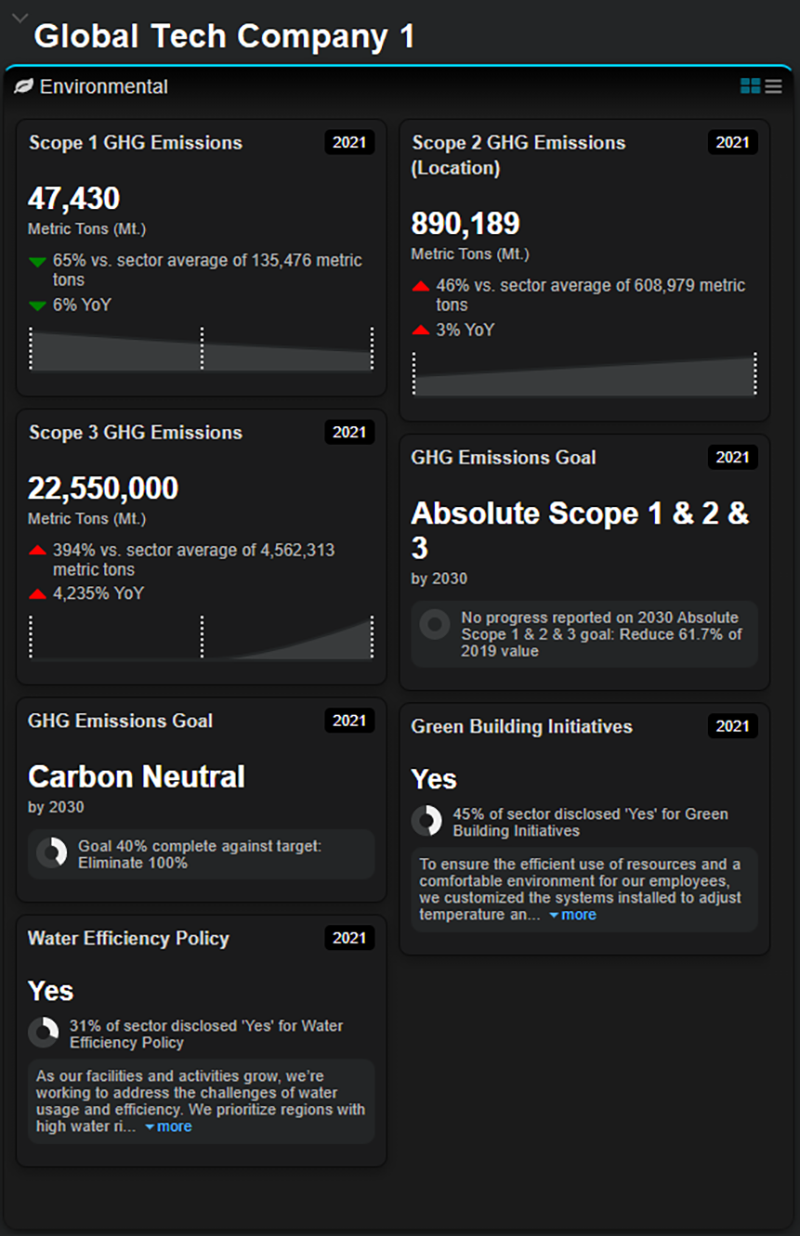
When investment managers or other key decision makers are attempting to compare two companies on the merits of their environmental commitment, being able to visualize their ESG data side-by-side can be helpful. The ICE ESG Viewer enables a user to conduct that type of analysis by providing metrics from ICE’s Sustainable Finance data in absolute terms, relative terms (vs. sector average), and temporally (year-over-year change). Some fascinating insights can be gleaned from drilling down in this manner. Consider the following example, in which we looked at emissions disclosures by two companies that might be considered close peers given they operate in the similar markets, produce comparable products, and are both large cap, global technology firms. Despite the similarities, the companies look quite different when analyzing their GHG emissions disclosures.
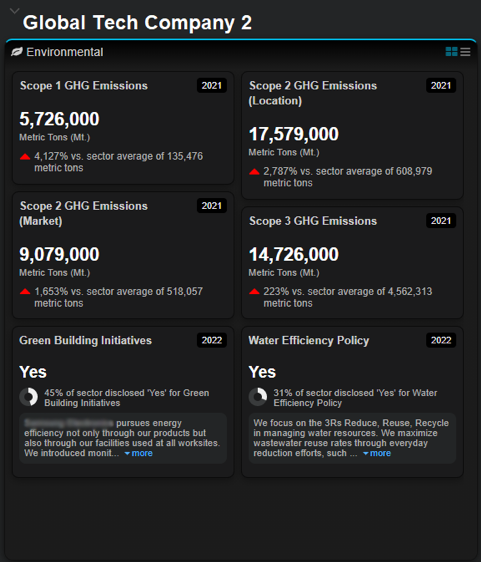
- In the ICE ESG Viewer we can see that Company 1 has disclosed quite low Scope 1 and 2 emissions, but relatively large Scope 3 emissions. By contrast, Company 2 has a more evenly distributed emissions footprint. This difference could be because one company may rely heavily on third party distribution and supplier relationships, versus another company that is more vertically integrated.
- Another interesting observation is that Company 2 opted to disclose its emissions in more detail, providing both the location-based and market-based measures for Scope 2 GHG emissions. More granular reporting like this may assist investors to better understand how the purchase of renewable energy credits (RECs), which is considered in the market-based approach of calculating Scope 2 emissions, plays a role in the company’s emissions management strategy.
While snapshot summaries are an effective way to convey a company’s current state of affairs, there is additional value in understanding how a company got to where it is today. ICE can provide historical environmental data that can be utilized by investment professionals to reconstruct and follow the unique pathways that firms have taken toward emissions reduction.
Moving beyond GHG emissions, it’s important to note that the SEC proposal has additional elements that companies will need to adhere to and that investors may wish to include in their decision-making process. Specifically, firms would be required to disclose if carbon credits or RECs are used as part of their emissions management strategy.
Additionally, if an internal carbon price is being utilized, a company would have to disclose several different elements including: price per unit, total price and how it may change over time, and rational for using the internal price.
Here, ICE can deliver transparency through our environmental futures contracts and various index products, including the ICE Carbon Futures Index Family, which reflects pricing from the four most actively traded carbon markets in the world. As demonstrated by the ICECRBN Global Carbon Price (CPW Weighted) data, levels recently hit an all-time high and have shown elevated volatility in 2022.
ICECRBN Global Carbon Price (CPW Weighted)
Source: ICE Data Services
In addition, ICE’s nature-based carbon credit futures contract is one of the first exchange-traded products designed to measure the carbon sequestration and storage capabilities of nature. This contract delivers project-based carbon credits, allowing market participants to manage their carbon footprint.
Whether you’re searching for a deeper understanding of ESG differences across companies (geographically, by index, by sector, etc.) or would like data to assist your firm in its disclosure, ICE has solutions to help.
Learn more about ICE Sustainable Finance Data
Related Content
This document contains information that is confidential and proprietary property and/or trade secrets of ICE Data Pricing & Reference Data, LLC and/or its affiliates, and may not be published, reproduced, copied, disclosed, or used without the express written consent of ICE Data Pricing & Reference Data, LLC. The information contained herein is, to the knowledge of ICE Data Pricing & Reference Data, LLC, current as of the date hereof, but is subject to change, without notice. The information contained herein is for informational purposes only, does not constitute representations or warranties by ICE Data Pricing & Reference Data, LLC, and does not alter the terms of any agreements that may from time to time exist between ICE Data Pricing & Reference Data, LLC and/or its affiliates and its clients or their affiliates relating to any of the products or services described herein. This document is not an offer of advisory services and is not meant to be a solicitation, or recommendation to buy, sell or hold securities. This document represents Intercontinental Exchange, Inc. and/or its affiliates’ observations of general market movements. Trades and/or quotes for individual securities may or may not move in the same direction or to the same degree as indicated in this document. Please note that the information may have become outdated since its publication. Nothing herein is intended to constitute legal, tax, accounting, or other professional advice. Clients should consult with an attorney, tax, or accounting professional regarding any specific legal, tax or accounting situation. Trading Analytics available from ICE Data Pricing & Reference Data are a point in time output and as such dependent on and take into account the information available to ICE Data Pricing & Reference Data at the time of calculation. ICE Data Pricing & Reference Data does not have access to all relevant trade-related data or dealer quotes, and the utility of the output may diminish depending upon amount of available data underlying the analysis. The inputs utilized in each of the Trading Analytics services described herein depend on the methodologies employed by each such service and may not be the same as the inputs used in the other Trading Analytics services. There are many methodologies (including computer-based analytical modelling) available to calculate and determine information such as Trading Analytics described herein. ICE Data Pricing & Reference Data’s Trading Analytics may not generate results that correlate to actual outcomes, and/or actual behavior of the market, such as with regard to the purchase and sale of instruments. There may be errors or defects in ICE Data Pricing & Reference Data’s software, databases, or methodologies that may cause resultant data to be inappropriate for use for certain purposes or use cases, and/or within certain applications. Certain historical data may be subject to periodic updates over time due to recalibration processes, including, without limitation enhancement of ICE Data Pricing & Reference Data’s models and increased coverage of instruments. Although ICE Data Pricing & Reference Data may elect to update the data it uses from time to time, it has no obligation to do so. Fixed income evaluations, continuous evaluated pricing, end-of-day evaluations, evaluated curves, model-based curves, market sentiment scores, and Fair Value Information Services related to securities are provided in the US through ICE Data Pricing & Reference Data, LLC and internationally through ICE Data Services entities in Europe and Asia Pacific.
Trademarks of Intercontinental Exchange, Inc. and/or its affiliates include: Intercontinental Exchange, ICE, ICE block design, NYSE, ICE Data Services, and New York Stock Exchange. Information regarding additional trademarks and intellectual property rights of Intercontinental Exchange, Inc. and/or its affiliates is located at www.intercontinentalexchange.com/terms-of-use. Other products, services, or company names mentioned herein are the property of, and may be the service mark or trademark of, their respective owners.
If you are receiving this email in error, please notify us by contacting customer support at the contact details listed in this email.
© 2022 Intercontinental Exchange, Inc.