


ICE Data Services Derivatives Sales Specialist

ICE Data Services Manager, Business Development
From semiconductors to chicken wings, companies across the world are scouring their networks to ensure their distribution channels can withstand supply-chain turmoil. The COVID-19 pandemic’s strain on the supply chain has driven up the cost of freight, caused massive backlogs and forced firms to rethink how — and where — they get their materials, labor and other key operational inputs.
Managing counterparty risk is no longer the sole concern of the corporate treasury, accounting and finance departments. Business operations, product development and strategy teams are increasingly looking for ways to monitor all their touchpoints and relationships, including through the use of credit default swap (CDS) data.
CDSs are generally used for hedging long exposure to a borrower and serve as insurance contracts that pay a holder in the event of a default. As each CDS is tied to an underlying credit or issue, it is commonly traded and referenced as a type of credit derivative. CDS pricing is driven by market forces, which are constantly assessing and quantifying any changes in a borrower’s likelihood to repay their debt. For this reason, they tend to be responsive and timely indicators of potential stress or deterioration in credit profiles, often underscoring problems before they appear in more traditional fixed income or equity securities. A concern that arises in the pricing of a CDS instrument can spell out trouble for other securities or dependencies associated with that underlying company or issuer down the road. The ability to measure and analyze these trends or changes in CDS levels can serve as a useful input when making decisions across a supply chain.
Putting CDS Data to the Test
To highlight how a business strategist or corporate decision maker might use CDS, we applied our data to a sample of companies involved in the automotive supply chain. There’s been no dearth in reporting that the automotive supply chain has been impacted in the past two years — which has been attributed to a shortage of new cars and sharp spike in the price of used cars. Understanding how financial markets price creditworthiness across different entities that make up a company’s critical reliance network can help businesses identify when and where they might want to take proactive steps to protect themselves.
As part of our analysis, we used real company data — which we anonymized — across the automotive supply chain to create an example, as shown in figure 1, of what the analysis process might look like for any company along that chain. By selecting several companies that may be connected to each other, we can better understand the relationship between them and how problems with one of them might lead to additional issues up or down the line.
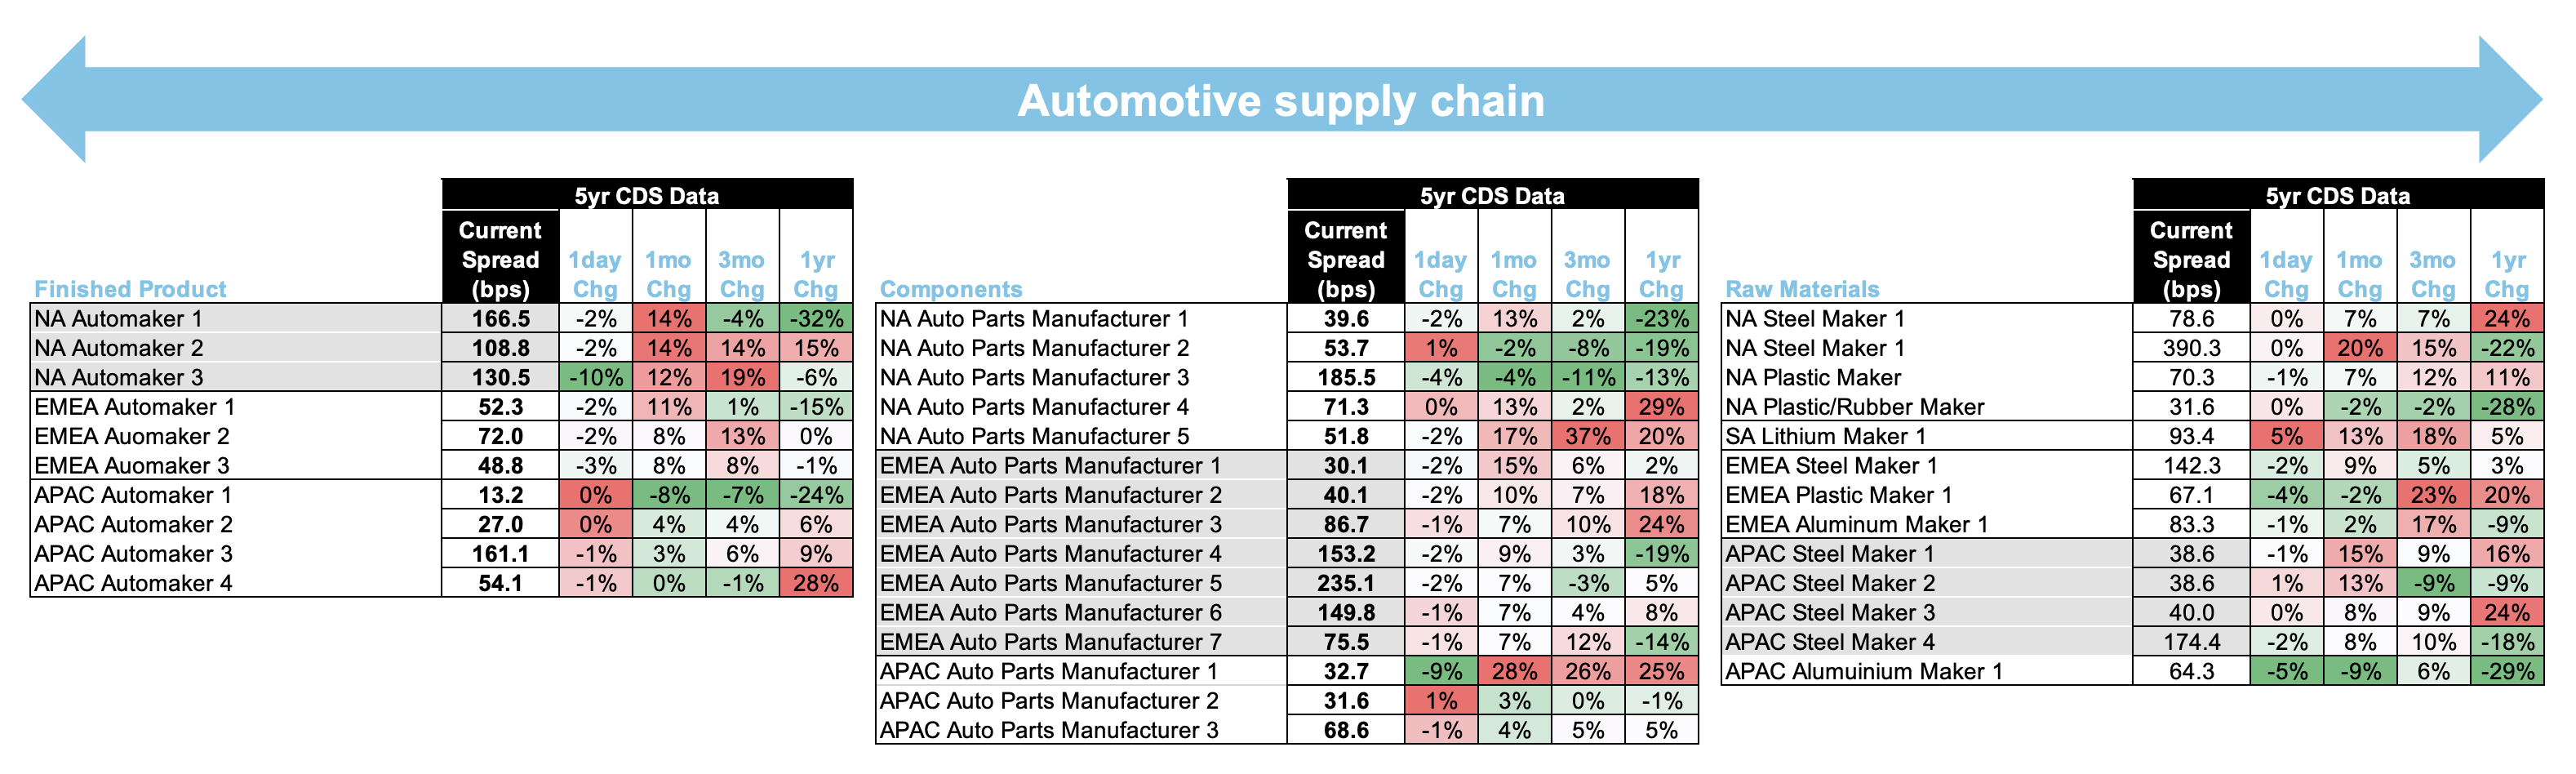
Figure 1
Click image to expand
Source: ICE Data Services, Feb. 2, 2022. Color signifies magnitude, with red indicating a widening (or negative credit) trend and green indicating tightening (of a positive credit) trend.
By using ICE Data Derivatives’ CDS data, we constructed a network of potential relationships that an automaker might rely on when assembling a vehicle. For example, as shown in figure 1, a North American (NA) automaker may rely on a European (EMEA) auto parts manufacturer for the components but on an Asia Pacific (APAC) steel maker for raw materials. Understanding how CDS data is changing in the near term or over time can illuminate issues and help users quickly identify how changes in attitude toward a specific company, sector or region might affect a producer’s ability to build and sell their cars.
Using CDS Data for Sovereign Curves
It is important to monitor and understand the regions and sectors where a business’ operational and counterparty risk exist. The physical location of raw materials, parts suppliers and distribution hubs represent a significant piece of the risk management puzzle for corporate development offices. Geopolitical events, natural disasters and infrastructure failures all have the potential to impact business lifecycles regionally, trickling down to the end-user.
The ICE Curve Viewer application allows users to visualize, compare and analyze time series trends across the CDS marketplace, including sovereign curves. The viewer allows users to access over 6,000 curves, including a growing library of Evaluated Bond curves1 and CDS curves, providing specific spread/yield information for tenor points across the curve.
In our automaker example, we focused on the beginning of the supply chain and considered countries where specific raw materials were mined or produced. By using the Curve viewer, we can examine exposures in South America, for example, a common exporter and origin of raw materials and components. Monitoring signals across emerging market and sovereign CDS data can benefit strategy or business operations teams — if the CDS levels widen in key locations that export rubber, steel and lithium, this could potentially have a negative effect on the accessibility of those resources.
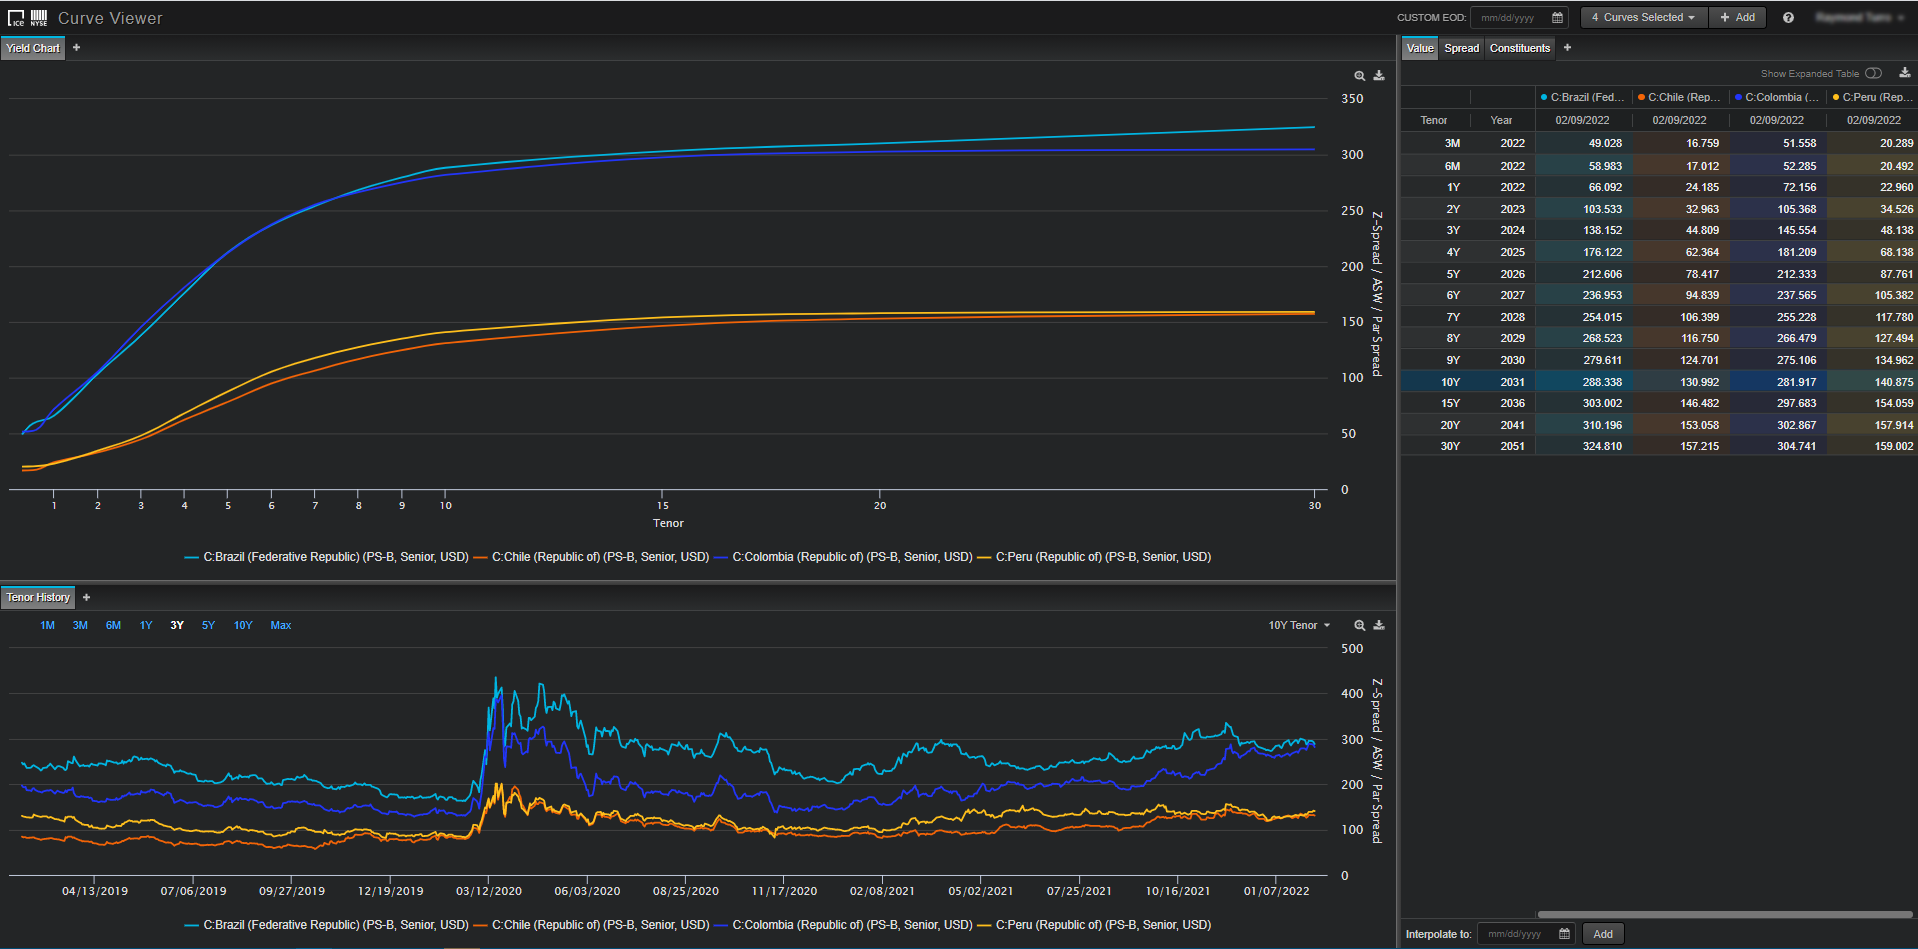
Click image to expand
Source: ICE Portfolio Analytics, Dec. 31, 2021
This screenshot from the ICE Curve Viewer provides users a way to quickly analyze and compare different issuers — in this case the light blue represents Brazil, the orange represents Chile, the dark blue represents Colombia and the yellow represents Peru. The top left of the screen shows the full CDS curve up to a 30-year tenor. In this scenario, Brazil and Colombia CDS data indicate that the market is more cautious about their credit risk, with their spreads higher than Chilean and Peruvian credit. Brazilian and Colombian spreads remained tight, converging early across tenor and diverging at the 30-year mark, while Chilean and Peruvian spreads widened slightly at the beginning but converged as the tenor matures. The datapoints used to construct these curves are detailed on the right-hand side of the screen. The full history of a particular tenor can be seen at the bottom of the screen, putting today’s values into perspective. The massive spike occurring in March 2020 highlights some of the shocks experienced by those economies at the onset of the COVID-19 pandemic.
CDS data is an effective instrument that can be utilized in various scenarios, including to help improve business intelligence, monitor competitive sentiment, and expand the scope of supply chain distribution analysis. When combined with ICE’s reference data, customers can link individual securities to business entities and broader sector classifications for additional insights.
ICE processes millions of pieces of credit market data, which are then cleansed and validated by a rigorous process. The CDS universe comprises more than 14 years of historical data and daily coverage of 2,500 Single Names, Indices, Tranches, Sovereigns and Quantos worldwide.
In addition to CDS curves, ICE provides a comprehensive bond curves offering comprising evaluated curves, created by using inputs of constituent bond evaluations, and model-based sector curves created using bond evaluations as an input into regression models to produce granular sector curves defined by various bond attributes including, but not limited to, geographical region or country of issuance, tier, rating and industry sector2. The CDS Curves, evaluated and model-based curves are available to clients for monitoring counterparty credit, business risk as well as additional use cases.
1 Evaluated Bond curves are offered through ICE Data Pricing & Reference Data, LLC in the U.S. and internationally through ICE Data Services entities in Europe and Asia Pacific.
2 Bond evaluations, evaluated curves, and model-based sector curves are offered through ICE Data Pricing & Reference Data, LLC and internationally through ICE Data Services entities in Europe and Asia Pacific.
Learn more about ICE Derivatives Data and Analytics
Limitations
This document contains information that is confidential and proprietary property and/or trade secret of Intercontinental Exchange, Inc. and/or its affiliates, is not to be published, reproduced, copied, disclosed or used without the express written consent of Intercontinental Exchange, Inc. and/or its affiliates.
This document is provided for informational purposes only. The information contained herein is subject to change without notice and does not constitute any form of warranty, representation, or undertaking.
Nothing herein should in any way be deemed to alter the legal rights and obligations contained in agreements between Intercontinental Exchange, Inc. and/or any of its affiliates and their respective clients relating to any of the products or services described herein. Nothing herein is intended to constitute legal, tax, accounting, or other professional advice.
Services provided by ICE Data Derivatives UK Limited shall not constitute, or be construed, as investment advice.
Fixed income evaluations, continuous evaluated pricing, end-of-day evaluations, evaluated curves, model-based curves, market sentiment scores and Fair Value Information Services related to securities are provided in the US through ICE Data Pricing & Reference Data, LLC and internationally through ICE Data Services entities in Europe and Asia Pacific. ICE Data Pricing & Reference Data, LLC is a registered investment adviser with the US Securities and Exchange Commission. Additional information about ICE Data Pricing & Reference Data, LLC is available on the SEC’s website at www.adviserinfo.sec.gov. A copy of ICE Data Pricing & Reference Data, LLC’s Form ADV is available upon request.
Intercontinental Exchange, Inc. and its affiliates, makes no warranties whatsoever, either express or implied, as to merchantability, fitness for a particular purpose, or any other matter. Without limiting the foregoing, Intercontinental Exchange, Inc. and its affiliates makes no representation or warranty that any data or information supplied to or by it are complete or free from errors, omissions, or defects.
Trademarks of Intercontinental Exchange, Inc. and/or its affiliates include: Intercontinental Exchange, ICE, ICE block design, NYSE, ICE Data Services, ICE Data and New York Stock Exchange. Information regarding additional trademarks and intellectual property rights of Intercontinental Exchange, Inc. and/or its affiliates is located at www.ice.com/terms-of-use. Other products, services, or company names mentioned herein are the property of, and may be the service mark or trademark of, their respective owners.