
The link between access to U.S. municipal debt and socioeconomic outcomes
A comprehensive analysis of public school districts
Published
January 2023
Authors
The U.S. Census Bureau estimates that over 11 million children were living in poverty in the United States in 2021.1 The effects of this poverty will be far-reaching since, according to the American Academy of Pediatrics, child poverty is associated with a range of negative health and developmental outcomes.2 As children go through school, the impacts of poverty extend to educational outcomes, including higher dropout rates3 and lower test scores.4 Disparities in educational outcomes perpetuate the poverty cycle, with median career earnings for college graduates over twice as high as those with only a high school diploma.5
In 2020, The Century Foundation, an independent think-tank, published estimates of “the education funding gap,” the additional funding that would be required to raise up students in all school districts across the country to national average levels of math and reading proficiency.6 According to the report, over half of U.S. school districts serving over 30 million children cannot provide adequate funding for their students, and a disproportionate share of these districts serve socioeconomically vulnerable communities.
Within the U.S. public school financing system, the municipal bond market plays an important role, allowing some school districts to raise capital for infrastructure. In this research, we examine the interplay between school district debt, the socioeconomic characteristics of school districts, and student and district outcomes. Our focus on municipal debt within America’s public school system is motivated by the many connections between educational outcomes, poverty, and health. In a 2009 report, the RAND Corporation estimated that the average cost savings to taxpayers of increasing one person’s education level from some high school to a high school diploma would be between $74,000 and $186,000 through reduced future demands on support programs and increased tax payments.7 Another study puts the net public benefit of each new high school graduate at $127,000.8
We present an analysis of over 12,600 school districts across the country using data from ICE and publicly available sources, alongside a review of academic literature. Our goal is to inform municipal bond market participants and stakeholders about how capital allocation and policy choices may impact students, school districts, and communities across the U.S. for decades to come.
Summary of key findings:
- ICE’s Social Impact Score, which uses dozens of underlying Census variables to measure vulnerability and financial need across seven key socioeconomic dimensions, is closely correlated with educational outcomes.
- ICE’s Social Impact Score is also correlated with school districts’ level of access to the municipal bond market. Districts with low Social Impact Scores (Low Social Impact) are generally more affluent and carry more municipal debt per pupil than districts with high Social Impact Scores (High Social Impact) that are less affluent.
- About 21% of High Social Impact districts (Social Impact Score > 50) carry no debt; for the Low Social Impact districts (Social Impact Score <5), this number falls to less than 9%. Across states with explicit credit enhancement programs, a greater proportion of High Social Impact districts carry debt.
- There are positive associations between debt per pupil and student outcomes (e.g., graduation rates, mathematics and reading proficiency rates) and community poverty levels after controlling for basic demographic and socioeconomic factors.
- Investors may be able to meaningfully change socioeconomic outcomes, particularly for children, by allocating more capital to communities with higher Social Impact Scores.
- Policymakers in many states could consider adopting school district credit enhancement programs that correlate with increased access to debt capital.
- Because affluent communities have disproportionate access to debt financing, regulators and policymakers could bolster subsidies or other programs at the Federal level, targeting High Social Impact communities to enhance their access to low interest municipal capital. Such programs would likely promote equality of opportunity and American competitiveness on the global stage.
ICE’s Social Impact Score is closely correlated with school district outcomes
ICE’s Social Impact Score9 provides a useful lens for understanding the relationships between student outcomes, student need, poverty, and school district debt. Underpinned by a wealth of demographic, socioeconomic, housing, education, employment, and health data from the U.S. Census, the U.S. Bureau of Labor Statistics, and the Centers for Disease Control, and Prevention,10 , 11, 12, 13 the Social Impact Score quantifies the potential socioeconomic benefit of investment in a community, town, school district, or any other geographically defined entity that can issue debt (Figure 1). Importantly, the score is also easy to interpret – the greater the score of a community (0-100), the greater the need for and potential impact of investment.
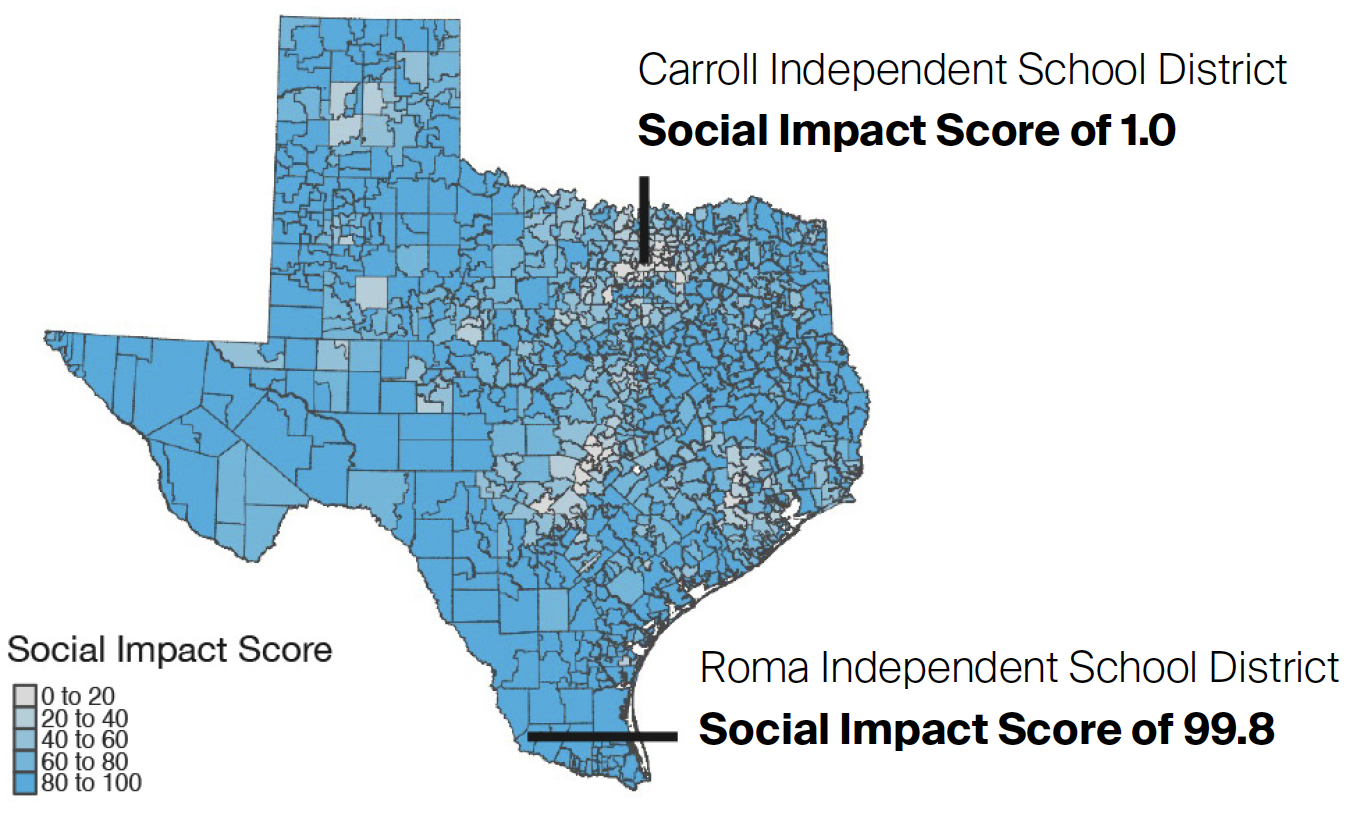
Social Impact Score of 100: High socioeconomic vulnerability Large potential impact of investment
Social Impact Score of 0: Low socioeconomic vulnerability Low potential impact of investment
Figure 1. Map of Texas school districts and their Social Impact Scores. Carroll Independent School District, a district serving the affluent community of Southlake, Texas in the Dallas-Fort Worth area, has a Low Social Impact score, while the Roma Independent School District in south Texas has a High Social Impact score. Source: ICE Data Pricing and Reference Data as of 11/01/22.
1 Creamer, J., Shrider, E., Burns, K., & Chen, F. (2022, September). U.S. Census Bureau, Current Population Reports, P60-277, Poverty in the United States: 2021, U.S. Government Publishing Office. (Source)
2 Council on Community Pediatrics, Gitterman, B., Flanagan, P., Cotton, W., Dilley, K., Duffee, J., Green, A., Keane, V., Krugman, S., Linton, J., McKelvey, C., & Nelson, J. (2016). Poverty and Child Health in the United States, Pediatrics, 137(4), e20160339. (Source)
3 Chapman, C., Laird, J., Ifill, N., & KewalRamani, A. (2011). Trends in High School Dropout and Completion Rates in the United States: 1972–2009 (NCES 2012-006). U.S. Department of Education. Washington, DC: National Center for Education Statistics. (Source)
4 Ferguson. H., Bovaird. S, Mueller, M. (2007). The Impact of Poverty on Educational Outcomes for Children. Paediatrics Child Health, 12(8), 701-706. doi: 10.1093/pch/12.8.701.
5 Broady, K. & Hershbein, B. (2020, October 8). Major Decisions: What graduates earn over their lifetimes. The Brookings Institution. (Source)
6 The Century Foundation. (2020, July 22). Closing America’s Education Funding Gaps. The Century Foundation. (Source)
7 Carroll, S. & Erkut, E. (2009). The Benefits to Taxpayers from Increases in Students’ Educational Attainment. RAND Corporation. (Source)
8 Levin, H., Belfield, C., Muennig, P., Rouse, C. (2007). The Costs and Benefits of an Excellent Education for All of America’s Children (Working Paper). Teachers College Press, Columbia University. (Source)
9 ICE Data Pricing and Reference Data, LLC is used with permission. ICE is a registered trademark of Intercontinental Exchange Inc. The ICE Social Impact Score and all underlying data referenced herein (poverty rates, percent of youth unemployed/not in school, and other socio-demographic data by school district) is the property of ICE Data Pricing & Reference Data, LLC and/or its affiliates (“ICE Data”).
10 U.S. Census Bureau. (2013-2020). American Community Survey [Data set]. (Source)
11 Centers for Disease Control and Prevention. (2013-2020). PLACES [Data set]. (Source)
12 U.S. Census Bureau. (2013-2020). LEHD Origin-Destination Employment Statistics (LODES) Data [Data set]. Longitudinal-Employer Household Dynamics Program. (Source)
13 U.S. Department of Labor. (2013-2020). Bureau of Labor Statistics Employment Data [Data set]. (Source)