
Environmental Markets
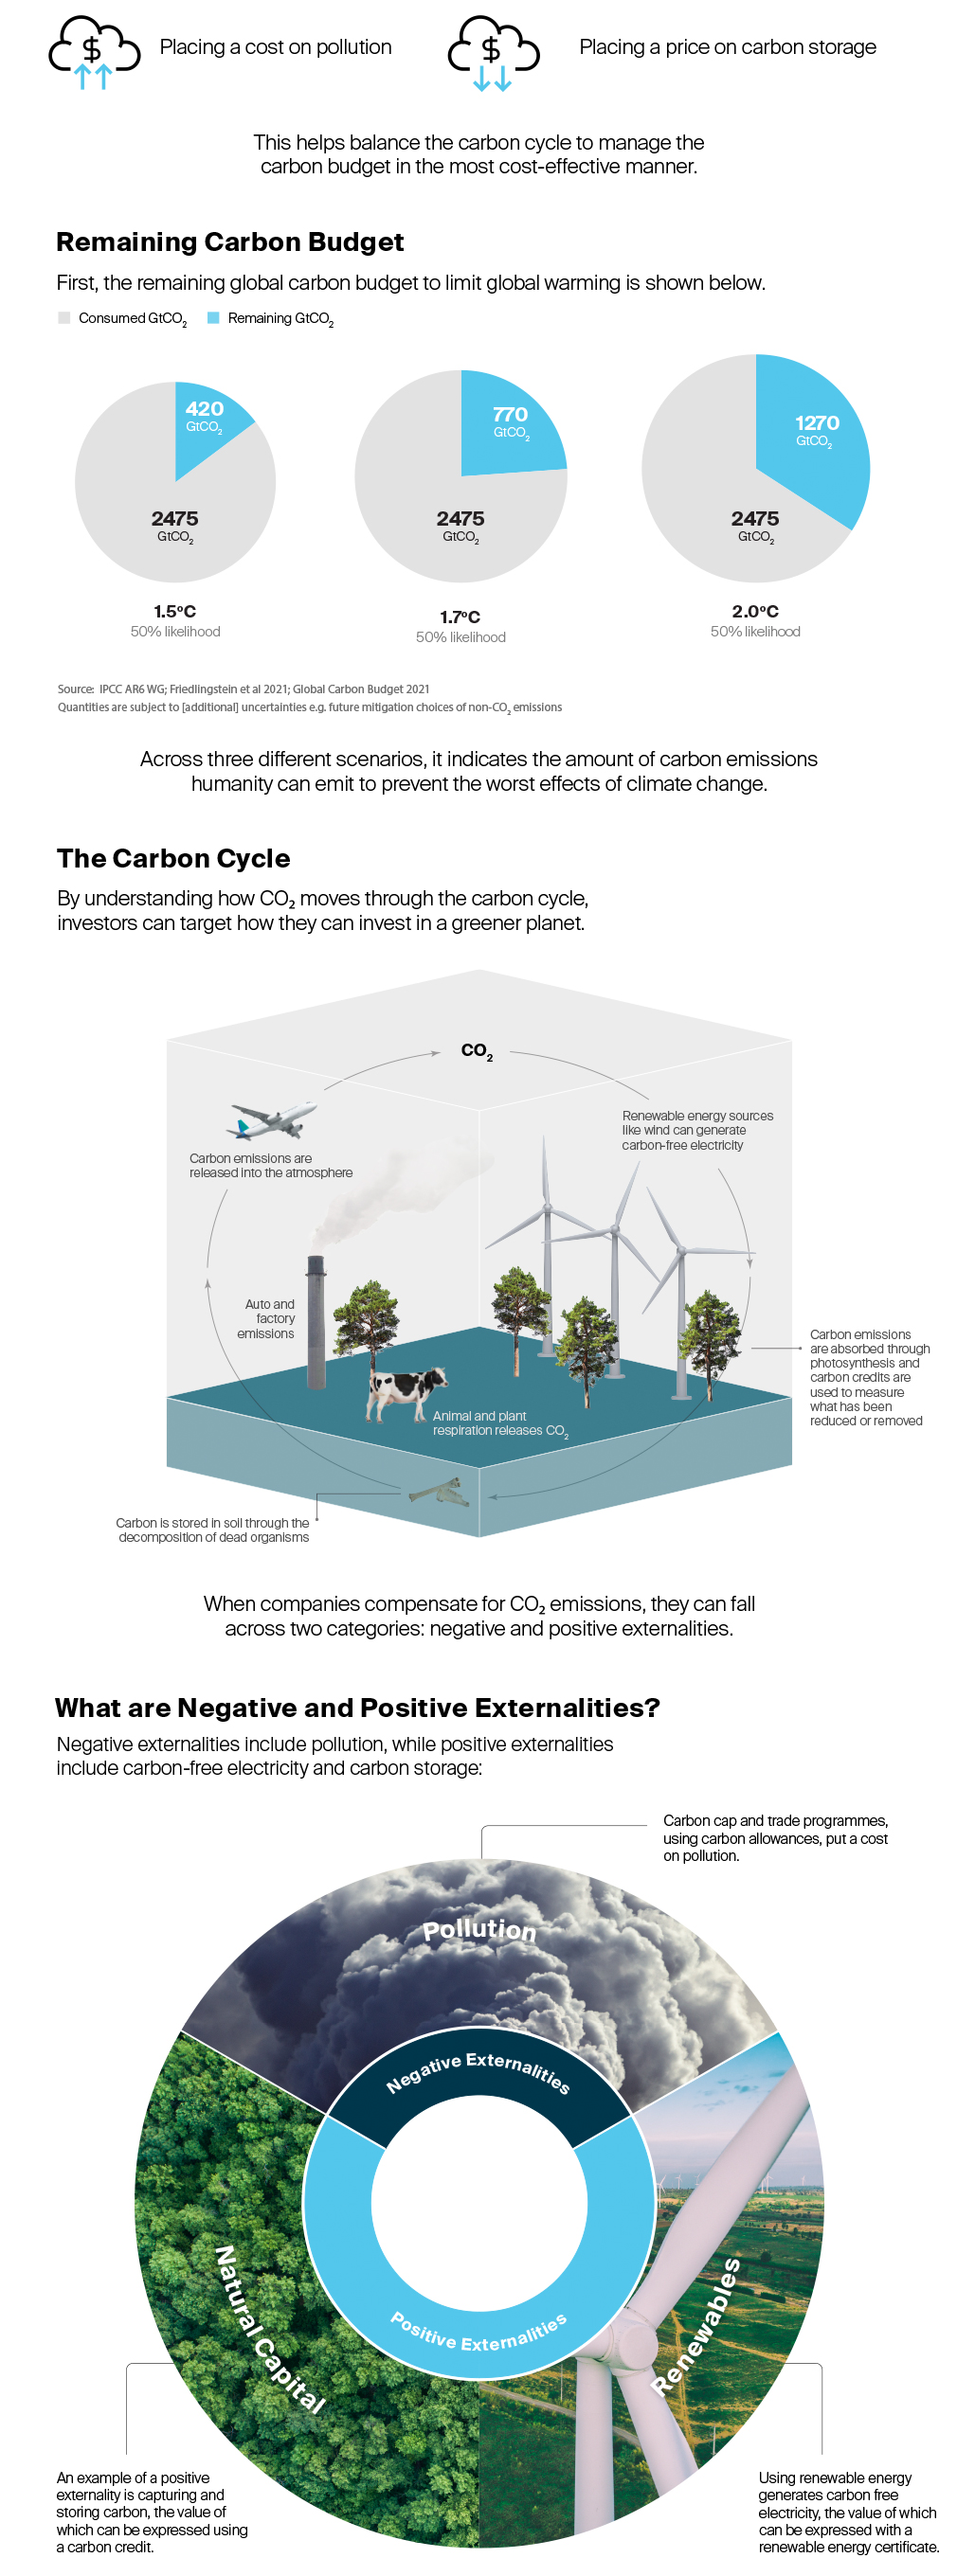
Helping balance the carbon budget
Achieving net zero
Change how we utilize energy and transition to less carbon-intensive fuels.
Put a value on the conservation of nature or "natural capital" and carbon sinks.
Change how we utilize energy and transition to less carbon-intensive fuels.
Put a value on the conservation of nature or "natural capital" and carbon sinks.
What are environmental markets?
Environmental markets and the energy transition
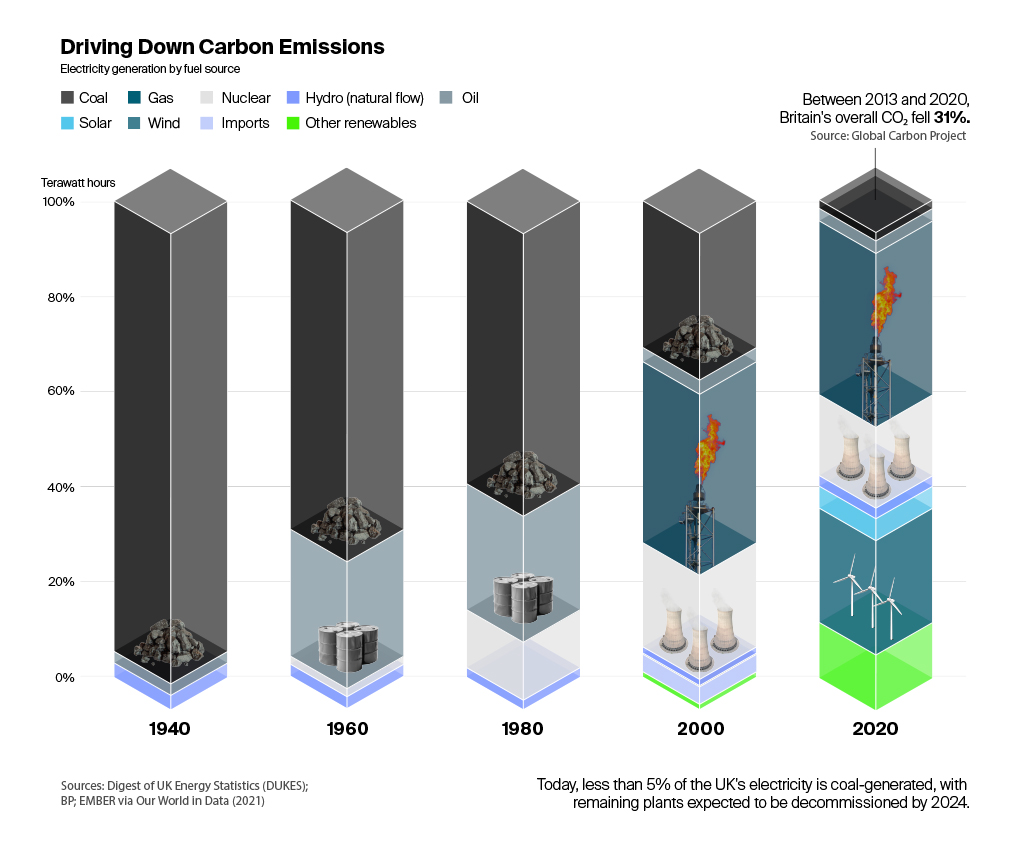
Environmental markets can drive the transition to cleaner energy sources by ascribing a cost to pollution and putting a premium on renewables, to change how we use energy. The UK illustrates how market-based mechanisms and policy can reduce carbon-intensive fuel from the mix. In 2013, the UK government introduced the Carbon Price Support mechanism to complement the emissions cap and trade program price signal and weaken the investment case for coal.
How environmental markets are advancing net zero
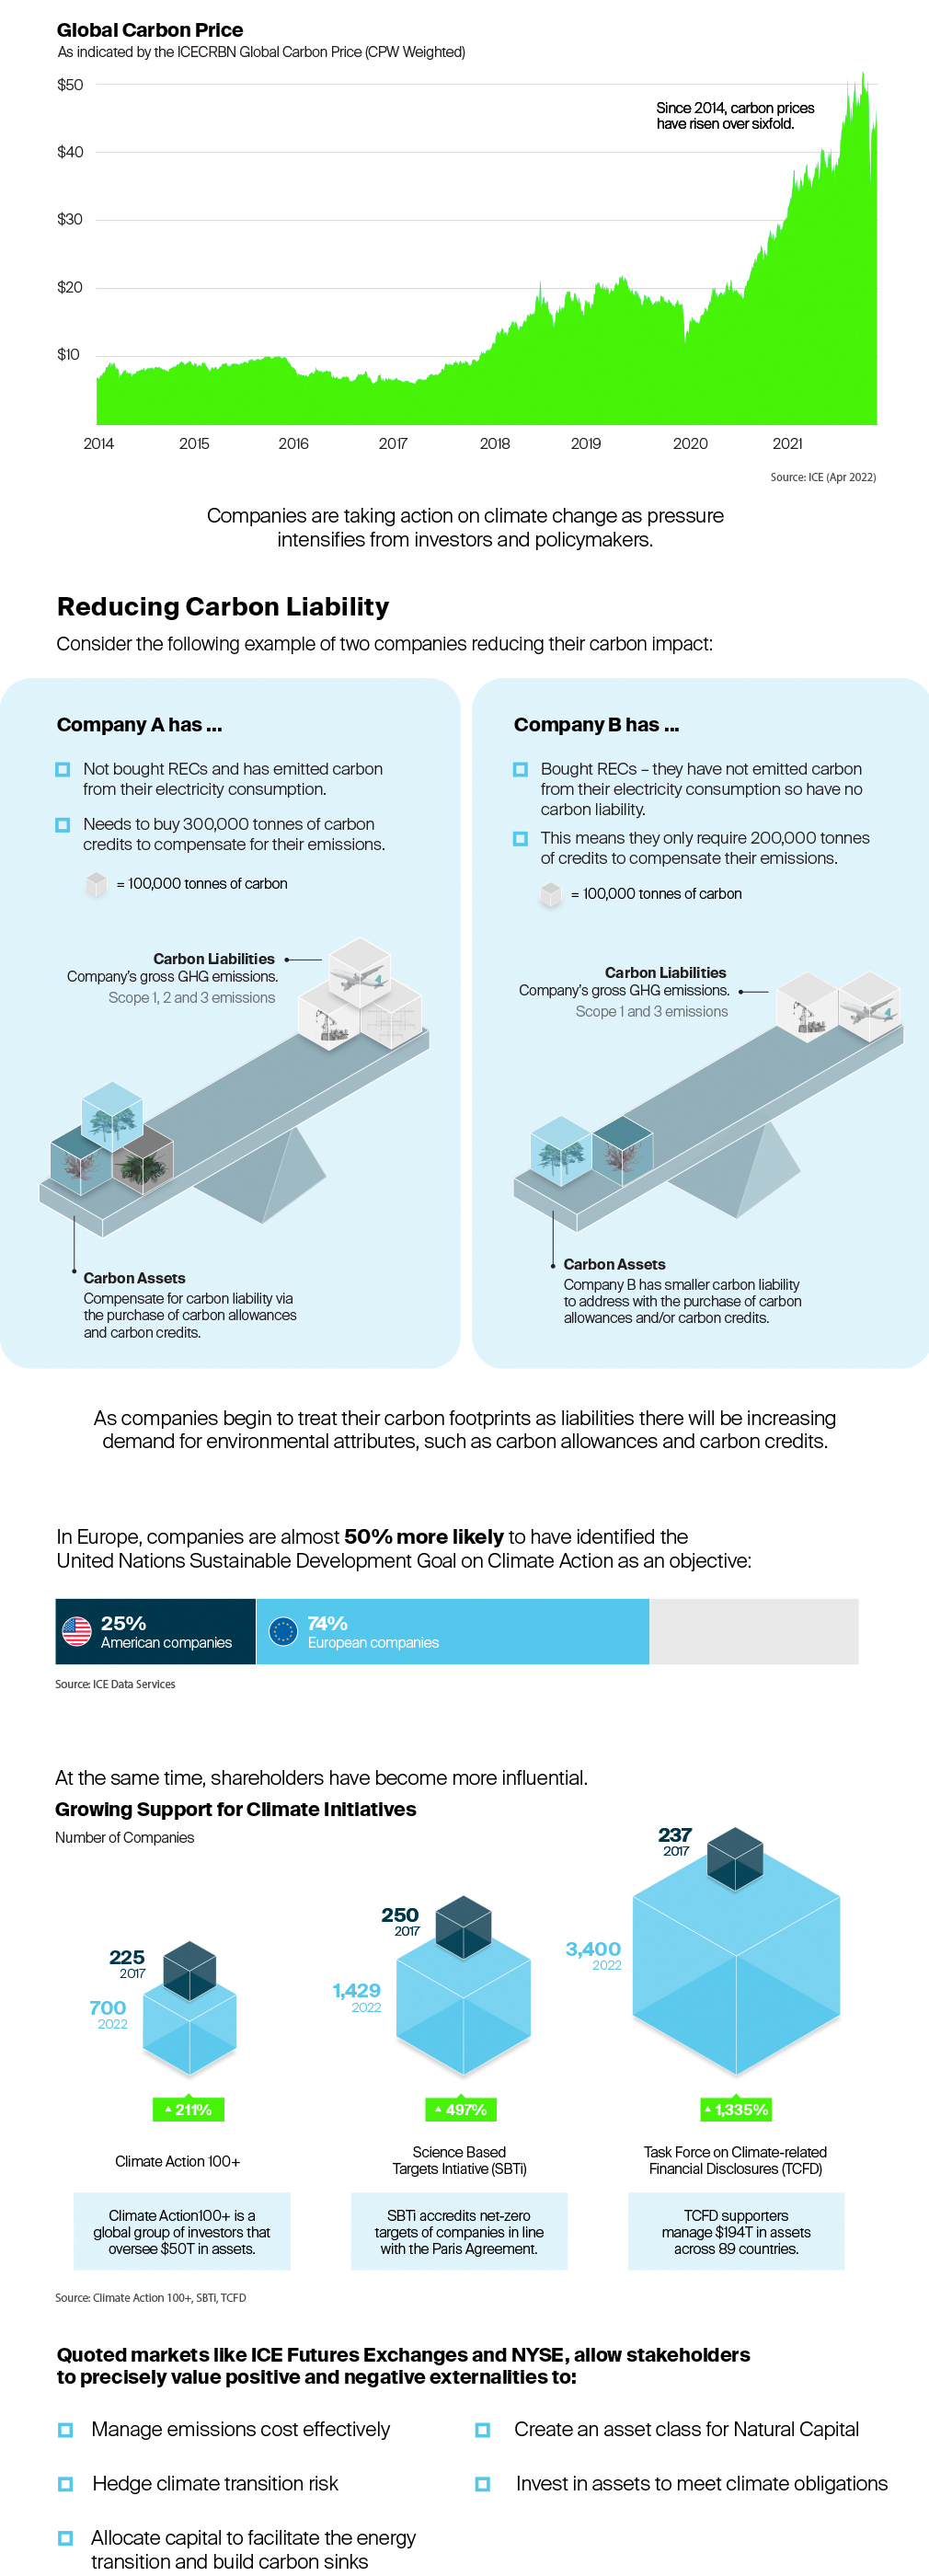
Managing risk and opportunity
Everyone is exposed to climate risk which means it needs to be measured and managed. Balancing the carbon cycle will be critical to managing the world's budget. Markets are providing greater access, liquidity and opportunity in the supporting net zero ambitions.
The information contained in this infographic - including text, graphics, links or other items - are provided "as is" and "as available." Intercontinental Exchange, Inc., its subsidiaries and affiliates (“ICE”) and third party providers do not warrant the accuracy, adequacy, timeliness, or completeness of this information, and expressly disclaims liability for errors, omissions or other defects, or delays or interruptions in this information. ICE does not verify any data and disclaims any obligation to do so. The information provided in this infographic is also liable to change at short notice. You should not rely on any information contained in this infographic without first checking with ICE that it is correct and up to date.
Nothing herein should in any way be deemed to alter the legal rights and obligations contained in agreements between ICE and its respective clients relating to any of the products or services described herein.
No warranty of any kind, implied, express or statutory, is given in conjunction with the information. The reliance on any information contained in this infographic is done at your own risk and discretion and you alone will be responsible for any damage or loss to you, including but not limited to loss of data or loss or damage to any property or loss of data or loss of revenue that results from the use and reliance on such information. In no event will ICE or its third party providers be liable for any damages, including without limitation direct or indirect, special, incidental, punitive, or consequential damages, losses or expenses arising out of or relating to your use of this information. Past performance is no guarantee of future results.
The content provided in this infographic is not to be construed as a recommendation or offer to buy or sell or the solicitation of an offer to buy or sell any security, financial product or instrument, or to participate in any particular trading strategy. ICE does not make any recommendations regarding the merit of any company, security or other financial product or investment identified in this infographic, nor does it make any recommendation regarding the purchase or sale of any such company, security, financial product or investment that may be described or referred to in this infographic, nor endorse or sponsor any company identified in this infographic. Prior to the execution of a purchase or sale of any security or investment, you are advised to consult with your banker, financial advisor or other relevant professionals (e.g. legal, tax and/or accounting counsel). Neither ICE nor its third party providers shall be liable for any investment decisions based upon or results obtained from the content provided in this infographic. Nothing contained on this infographic is intended to be, nor shall it be construed to be, legal, tax, accounting or investment advice. This presentation contains information that is proprietary property and/or trade secret of ICE, is not to be published, reproduced, copied, disclosed or used without the express written consent of ICE.
Trademarks of ICE include: Intercontinental Exchange, ICE, ICE block design, NYSE, ICE Data Services, ICE Data and New York Stock Exchange. Information regarding additional trademarks and intellectual property rights of ICE is located at www.intercontinentalexchange.com/terms-of-use. Other products, services, or company names mentioned herein are the property of, and may be the service mark or trademark of, their respective owners.
Intercontinental Exchange, Inc. @ 2022