


ICE Data Services Derivatives Sales Specialist
As we look back on the first quarter of 2022, returns across investable asset classes show some remarkably disparate results. The quarter was an unforgiving one for fixed income investors — bond markets suffered their biggest loss in more than 40 years, with Treasury markets sliding 5.6% and corporate bonds dropping almost 8%. After reaching new heights over the past two years, equity markets fell into correction territory and tech names that had shone so brightly during the early days of the pandemic dramatically pared their gains. Commodity markets, however, bucked the trend and meaningfully outperformed other asset classes — notching their best first quarter in the past 25 years. Looking across several of ICE’s benchmarks that represent some of these asset classes, the contrast is stark. The highlighted figures below also show that for some of these asset classes, the most recent results corresponded with either the best or worst first quarter returns in the past 25 years.
| Credit | Interest Rates | Equities | Foreign Exchange | Commodities | |
|---|---|---|---|---|---|
ICE BofA Global Corporate & High Yield Index | ICE BofA Global Government Index | ICE U.S. 1000 Index | ICE US Dollar Index | ICE BofA Commodity index eXtra | |
Q1 2022 | -6.68% | -4.74% | -5.34% | 2.79% | 35.01% |
Worst Q1 in past 25 years | -6.68% | -4.74% | -20.13% | -6.38% | 39.41% |
Best Q1 in past 25 years | 4.78% | 3.80% | 14.31% | 8.96% | 35.01% |
Source: ICE Data Services: March 31, 2022.
War, inflation and the lingering effects of the pandemic have preoccupied investors and market participants. The downturn has not been orderly, with volatility up significantly. Over the course of the quarter, we saw volatility rise meaningfully. The ICE BofA MOVE Index, which measures bond volatility, remains elevated — the index spent most of 2021 hovering in the 60s but recently jumped to highs, near 150, a level not seen since March 2020.
Against this backdrop, investors are seeking tools to help them manage their risk across various asset classes. Additionally, SEC Rule 18f-4 is a pressing concern for US fund market participants, with the August 19, 2022 implementation date quickly approaching. SEC Rule 18f-4 focuses on derivative risk and exposure, measuring across all asset classes held in the fund. Funds with derivatives exposures with >10% of NAV are required to run daily VaR calculations, weekly stress tests and model back-testing. For the rule, a minimum of three years of market data must be used to calibrate the models with portfolio 20-day 99% VaR remaining under either 200% of the designated reference benchmark portfolio or 20% of NAV. As the rule is broad and incorporates all asset classes held, historical data and sophisticated stress test methodology is necessary. On a summary level, the rule seeks to modernize the derivatives risk management framework for certain U.S. SEC-registered investment companies, including mutual funds (other than money market funds), ETFs, closed-end funds and business development companies.
VaR is a statistical measure of market risk of a specific security or a portfolio and helps investors quantify the potential losses they may be exposed to. It measures the amount of potential loss a portfolio is expected to have over a given confidence level and over a designated timeframe. Among other things, VaR is often used to help determine cash reserves that might be needed to cover unexpected portfolio losses, quantify how much short positions and derivatives increase or decrease a portfolio’s leverage, and optimize hedging strategies. The primary methods of calculating VaR include: Historical, Parametric and Monte Carlo simulation.
With the first quarter’s historically poor performance for fixed income now in the rearview mirror, it can be helpful to look back at just how some bonds fared. Using the ICE BofA Global Crossover Country Corporate & Government Index as a proxy for a risk seeking mixed asset portfolio, one can see the nature of the sell-off and how it played out at the constituent level.
Despite being issued by countries and/or their agencies, Sovereign and Quasi Sovereign bonds did not hold up much better than Corporate bonds, with many double-digit price declines observed for all categories. Additionally, bonds priced at or near par at the start the year, did not offer much solace either, as quite a few saw their values cut in half during the first quarter. In retrospect, the volatility and outsized market movements during the period illuminated the importance of prudent risk management.
ICE BofA Global Crossover Country Corporate & Government Index - Constituent Performance
Source: ICE Data Services
To help understand the exposures and how a portfolio manager or investment team might manage the risks laid out in the introduction, we used a proxy portfolio (the ICE BofA Global Crossover Country Corporate & Government Index) and assumed it was a $1 billion fund, using index weights for the holdings sizes. We opted to use an HVaR version of the value-at-risk calculation, which incorporates a historical data input length (the length of observation used for calibration). ICE’s HVaR modeling can help a risk management team understand what the potential loss might have looked like over the 45-day period ended March 31, 2022, which would have captured most of the volatility in the marketplace and key moments leading up to and during Russia’s invasion of Ukraine through April 7. The HVaR analysis, at a 99% confidence interval, for an unhedged version of the portfolio (index weighted bond constituents only) showed a potential loss of $52.4 million over the 45-day period.
ICE BofA Global Crossover Country Corporate & Government Index
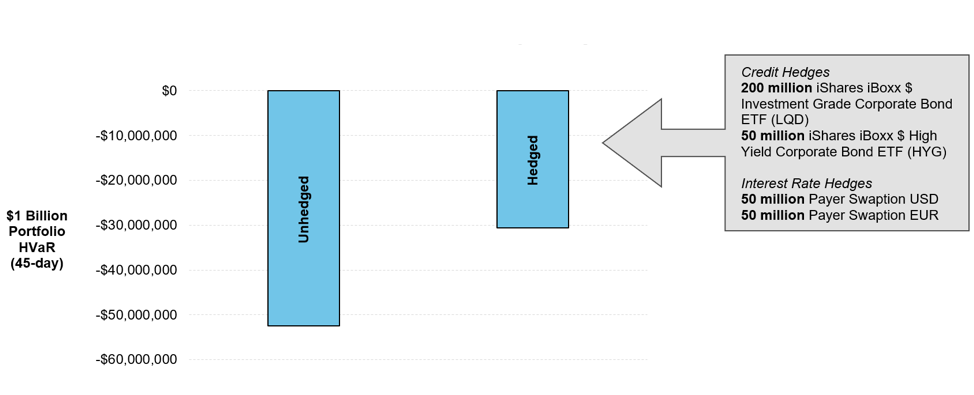
Source: ICE Data Services, March 31, 2022
However, when adding short credit and interest rate derivatives positions to hedge a portion of this risk, a portfolio manager could potentially reduce that exposure significantly. ICE has the capability to calculate the VaR for portfolios comprising these instruments, as well as foreign exchange, commodity, and equity derivatives. For a more extensive look-through of the theoretical hedges that were applied, please refer to the figure above. Over the same time period, the HVaR for a hedged version of the portfolio improved by nearly $22 million. ICE’s solution allows users to calculate the VaR on a mixed portfolio of asset classes, making it easier for users to get a fuller picture of their exposure through a single tool.
In this use case, zooming into Historical VaR, a predetermined period is defined. Using the changes in market data in that period, the movements are simulated and translated to the current marketplace and extrapolations can be made about what those movements would look like today (incorporating new instruments, changes in securities, ratings, etc.). A simulation is then run, testing the month-to-month changes in a portfolio based on previous historical market movement with a landscape that reflects today’s market. Results display the likely performance of a portfolio if previous market events were to reoccur, exposing portfolio reactions.
Most VaR models do not take such a short-term view and generally use a three-year horizon for their calculations. The exercise above was to highlight the tumult that was felt across credit and interest rate markets last quarter. Many of the regulatory frameworks also require more extensive VaR time horizons and data history. Using a three-year time period, the HVaR for the portfolio fell considerably, and for an unhedged portfolio stood at $43.7 million, while one that used the same hedges as outlined above would have approximately $40.8 million at risk. The ICE Portfolio Analytics - Derivatives (“IPA - Derivatives”) application displays summary portfolio HVaR information in addition to position level metrics with “tail” values and dates, allowing for more granular risk management analysis.
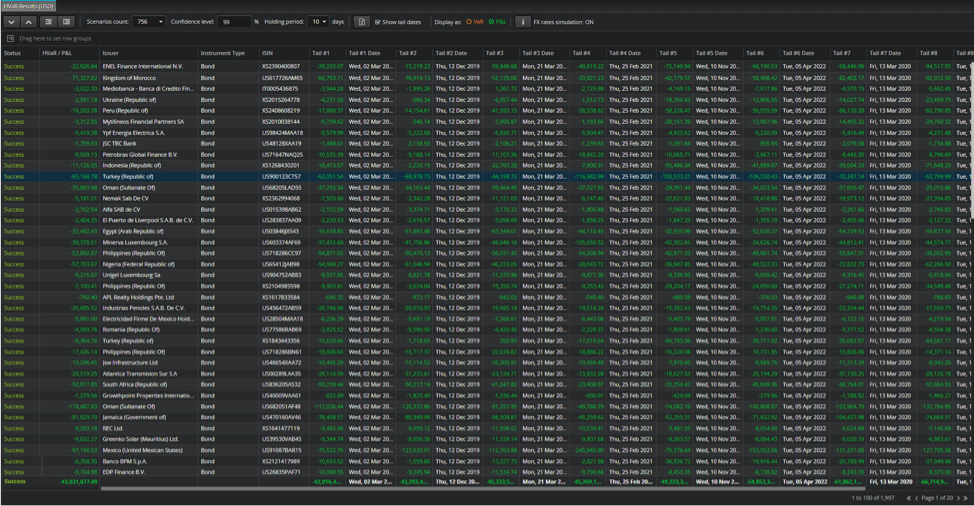
Source: ICE Data Services, April 21, 2022
If utilized correctly, VaR calculations may be able to expose securities or positions that could act as a catalyst and significantly harm the overall health and value of a portfolio. Identifying these positions may help risk managers and portfolio managers reduce the exposure and adjust hedges of vulnerable positions. ICE’s IPA-Derivatives platform also allows for deeper attribution level analysis at the portfolio constituent level. The IPA-Derivatives tool allows users to drill into what positions in particular are driving overall portfolio VaR, helping to identify outliers or concentrations that warrant attention. ICE’s tool also provides the historical data that is required for investment and risk management teams to meet those requirements.
In this example, the results across time periods change pretty dramatically. Over the 45-day window, the securities that were most impacted differed meaningfully from those over the three-year period. Egypt, for example, constituted one of the top 10 issuer countries with highest VaR contribution in the 45-day period but had extremely low correlation to other securities, suggesting that it was much more sensitive to the market volatility witnessed during the first quarter of 2022 than some of the other securities, which intuitively could be a function of the country’s heavy reliance on wheat imports from Russia and Ukraine.
Top 10 Contributors to VaR by Issuing Country over 45 days (hedged portfolio)
| VaR | Correlation | Contribution (Unadjusted) | Contribution (Adjusted) | Country of Issuance |
|---|---|---|---|---|
(4,048,217) | 81% | (3,282,955) | (2,228,497) | Mexico (Sovereign) |
(2,836,488) | 83% | (2,348,274) | (1,594,028) | Indonesia |
(5,747,561) | 39% | (2,268,738) | (1,540,038) | Egypt |
(3,312,260) | 62% | (2,045,886) | (1,388,765) | Turkey |
(2,612,640) | 74% | (1,922,986) | (1,305,339) | Mexico (Quasi) |
(1,862,416) | 84% | (1,573,428) | (1,068,056) | Romania |
(1,783,075) | 77% | (1,376,229) | (934,196) | Colombia |
(1,419,557) | 75% | (1,068,605) | (725,378) | Philippines |
(1,314,455) | 81% | (1,059,191) | (718,988) | Brazil |
(1,295,853) | 76% | (983,294) | (667,468) | Peru |
Source: ICE Data Services, April 21, 2022
Top 10 Contributors to VaR by Issuing Country over 3 years (hedged portfolio)
| VaR | Correlation | Contribution (Unadjusted) | Contribution (Adjusted) | Country of Issuance |
|---|---|---|---|---|
(3,310,951) | 74% | (2,464,491) | (2,634,985) | Mexico (Sovereign) |
(2,357,993) | 80% | (1,883,606) | (2,013,914) | Indonesia |
(3,183,230) | 45% | (1,416,542) | (1,514,539) | Turkey |
(1,950,413) | 60% | (1,177,742) | (1,259,219) | Mexico (Quasi) |
(1,612,989) | 71% | (1,140,383) | (1,219,275) | Romania |
(1,251,548) | 75% | (937,451) | (1,002,303) | Philippines |
(1,231,084) | 68% | (840,652) | (898,808) | Colombia |
(1,254,200) | 67% | (837,363) | (895,292) | Brazil |
(1,118,811) | 75% | (834,037) | (891,735) | Peru |
(1,166,174) | 71% | (824,283) | (881,307) | Panama |
Source: ICE Data Services, April 21, 2022
IPA-Derivatives is linked to ICE Data Derivatives’ steaming market data, including our proprietary theoretical price derivatives market data, which offers comprehensive data across the life cycle of a trade — from on-screen pricing and risk analytics to bookkeeping and position management. The tool allows front, middle, credit, collateral and risk management teams to view and analyze data throughout a trade’s lifecycle.
ICE’s SEC Rule 18f-4 solution is designed to assist clients in their new data- and analytics-heavy compliance programs by offering broad coverage across securities and derivatives, quality analytics through our ICE Portfolio Analytics - Derivatives platform, and robust historical simulations. ICE maintains a robust historical data library plus various VaR and stress testing models. To maintain a specified confidence level, portfolios require active maintenance — pushing to utilize proactive hedging and risk management tools. The solution’s key features include the ability to calculate the VaR ratio of a portfolio to a selected reference benchmark, the absolute VaR of a portfolio, stress testing with hypothetical scenarios, VaR model back testing and limited derivatives user testing.
Learn more about ICE Data Derivatives
Related Content
This document contains information that is confidential and proprietary property and/or trade secrets of Intercontinental Exchange, Inc. and/or its affiliates (the “ICE Group”), and may not be published, reproduced, copied, disclosed, or used without the express written consent of the ICE Group. The information contained herein is, to the knowledge of the ICE Group, current as of the date hereof, but is subject to change, without notice. The information contained herein is for informational purposes only, does not constitute representations or warranties by the ICE Group, and does not alter the terms of any agreements that may from time to time exist between the ICE Group and/or its affiliates and its clients or their affiliates relating to any of the products or services described herein. This document is not an offer of advisory services and is not meant to be a solicitation, or recommendation to buy, sell or hold securities. This document represents the ICE Group observations of general market movements. Trades and/or quotes for individual securities may or may not move in the same direction or to the same degree as indicated in this document. Please note that the information may have become outdated since its publication. Nothing herein is intended to constitute legal, tax, accounting, or other professional advice. Clients should consult with an attorney, tax, or accounting professional regarding any specific legal, tax or accounting situation. Fixed income evaluations, continuous evaluated pricing, end-of-day evaluations, evaluated curves, model-based curves, market sentiment scores, and Fair Value Information Services related to securities are provided in the US through ICE Data Pricing & Reference Data, LLC and internationally through ICE Data Services entities in Europe and Asia Pacific.
Services provided by ICE Data Derivatives, Inc. shall not constitute, or be construed, as investment advice by ICE Data Derivatives, Inc.
Analytics available from ICE Data Derivatives, Inc. are a point in time output and as such dependent on and take into account the information available to ICE Data Derivatives, Inc. at the time of calculation. ICE Data Derivatives, Inc. does not have access to all relevant trade-related data or dealer quotes, and the utility of the output may diminish depending upon amount of available data underlying the analysis. The inputs utilized in each of the analytics services described herein depend on the methodologies employed by each such service and may not be the same as the inputs used in the other analytics services. There are many methodologies (including computer-based analytical modelling) available to calculate and determine information such as the analytics described herein. ICE Data Derivatives, Inc. analytics may not generate results that correlate to actual outcomes, and/or actual behavior of the market, such as with regard to the purchase and sale of instruments. There may be errors or defects in ICE Data Derivatives, Inc. software, databases, or methodologies that may cause resultant data to be inappropriate for use for certain purposes or use cases, and/or within certain applications. Certain historical data may be subject to periodic updates over time due to recalibration processes, including, without limitation enhancement of ICE Data Derivatives, Inc. models and increased coverage of instruments. Although ICE Data Derivatives, Inc. may elect to update the data it uses from time to time, it has no obligation to do so.
Index products and services are provided by ICE Data Indices, LLC.
Trademarks of Intercontinental Exchange, Inc. and/or its affiliates include: Intercontinental Exchange, ICE, ICE block design, NYSE, ICE Data Services, and New York Stock Exchange. Information regarding additional trademarks and intellectual property rights of Intercontinental Exchange, Inc. and/or its affiliates is located at www.intercontinentalexchange.com/terms-of-use. Other products, services, or company names mentioned herein are the property of, and may be the service mark or trademark of, their respective owners. BofA® is a registered trademark of Bank of America Corporation licensed by Bank of America Corporation and its affiliates ("BofA") and may not be used without BofA's prior written approval.
If you are receiving this email in error, please notify us by contacting customer support at the contact details listed in this email.
© 2022 Intercontinental Exchange, Inc.