
Finding Needles in the Bond Market Haystack
Published
November 11, 2022
Authors


Business Development
A confluence of factors, ranging from inflation to war, have come together in 2022 to spark sharp asset price falls and historically poor year to date performance in bond markets. Coupled with a volatile trading environment these underscore the need for faster decision making, closer oversight, and more efficient investment analysis. Access to high quality data can be critical for success.
For fixed income market participants, the use of data in crafting an investment strategy can lead to vastly different outcomes. Consider just a few of the variations: geographic area, asset class, credit quality, sector/industry, duration, etc. As an example, let’s assume the persona of a US corporate bond fund who wants to express a view on the investment grade banking sector. At a high level, using the ICE US Banking Index as a reference this strategy is sitting on a loss of roughly -16% so far this year,. However, depending on which part of the capital stack was favored, the loss could have been mitigated by favoring higher quality credit. Similarly, the maturity date of investment selections could have softened the blow, if shorter duration bonds were chosen over those with longer terms.
Index Year-to-Date Total Return
Source: ICE Data Services
Investment professionals are tasked with security selection, portfolio creation, risk management and other workflows that rely on sifting through vast amounts of data which is often fragmented. The ICE Data Viewer helps solve this problem by combining reference data, pricing, and ESG metrics in a single tool. In the below screenshot, we show a filtering exercise to narrow down US corporate bonds in the Banking sector. This is made possible by leveraging the ICE Uniform Entity Sectors which offers multiple levels of industry, sector, and sub-sector granularity. From here, a decision maker could begin to use additional fields, such as amount outstanding to avoid issues that may not have sufficient notional to attract institutional buyers, or maturity date if there was a specific range targeted.
*Click to enlarge
Source: ICE Data Viewer
Once potential investment options have been narrowed using traditional fixed income attributes, a manager may wish to dig into non-traditional metrics. For example, GHG Emissions data at the issuer level is becoming more important for investors. The trend towards more transparency in the climate transition space was accelerated this year following an SEC proposal to standardize climate-related disclosures for investors. Using the ICE Data Viewer, our clients can quickly determine which issuers among a filtered sample are disclosing GHG Emissions data, and who may be leading or lagging the peer group in terms of progress toward stated goals. This can help inform security selection along ESG lines and act as a ‘data tiebreaker’, for instance, if a trader can meet all non-ESG investment requirements and quantify the impact of a portfolio’s holdings on the environment, this may be viewed as an added bonus.
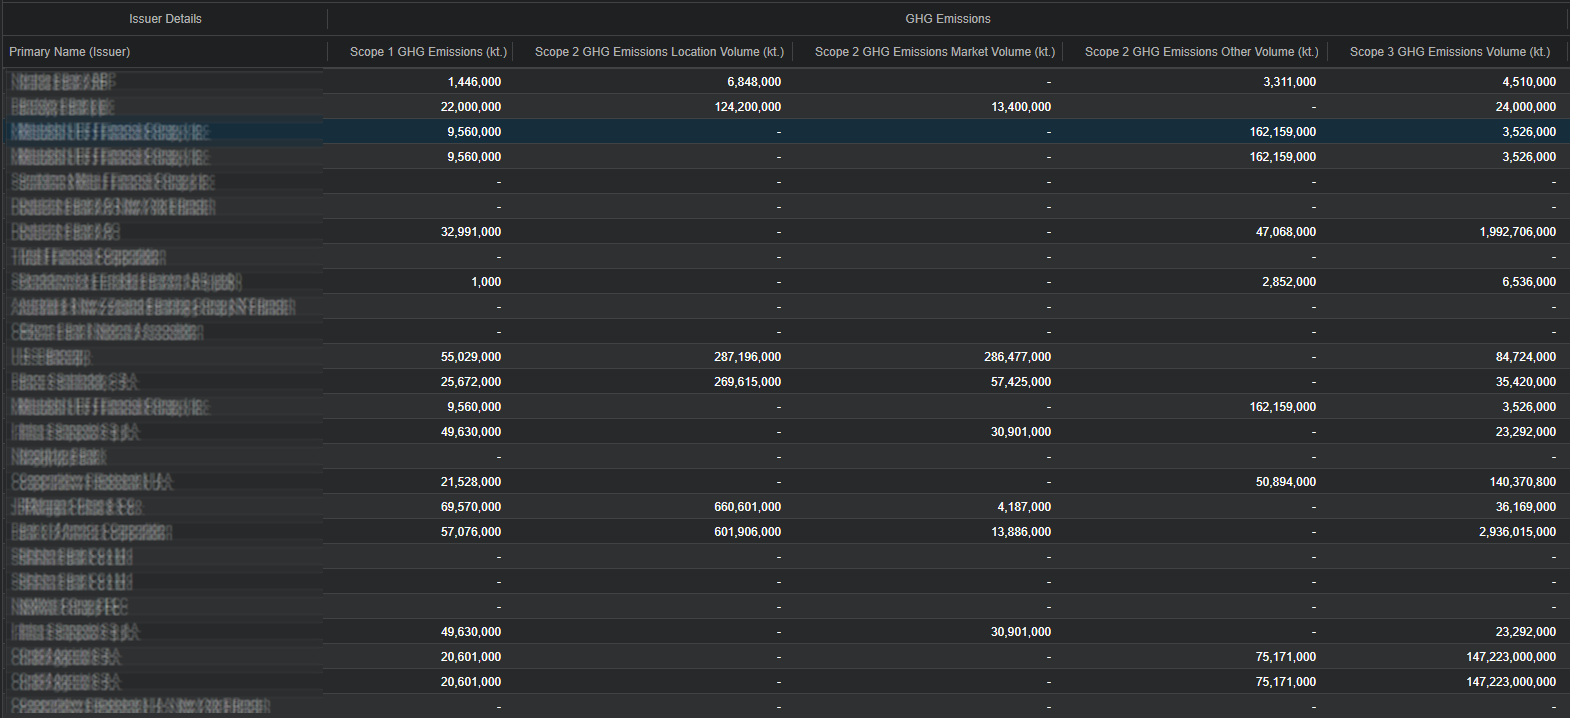
*Click to enlarge
Source: ICE Data Viewer
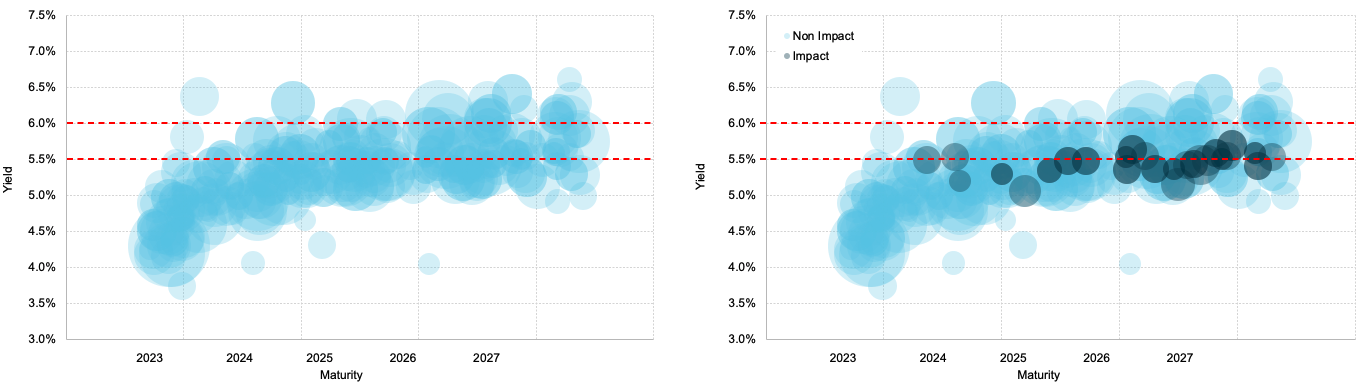
According to our recent analysis, global issuance of impact bonds was US$382.3 billion in H1 2022, down 16% from the same period a year earlier. The movement is largely in line with the broader fixed income market, with the percentage of impact bonds versus general bond issuance remaining broadly consistent, ranging between 2% and 4% over the past six months. The ICE Data Viewer can shed significant light on this burgeoning segment, allowing users to search specifically for impact bonds, stratify an existing portfolio, and assess certain aspects of disclosure around these types of securities.
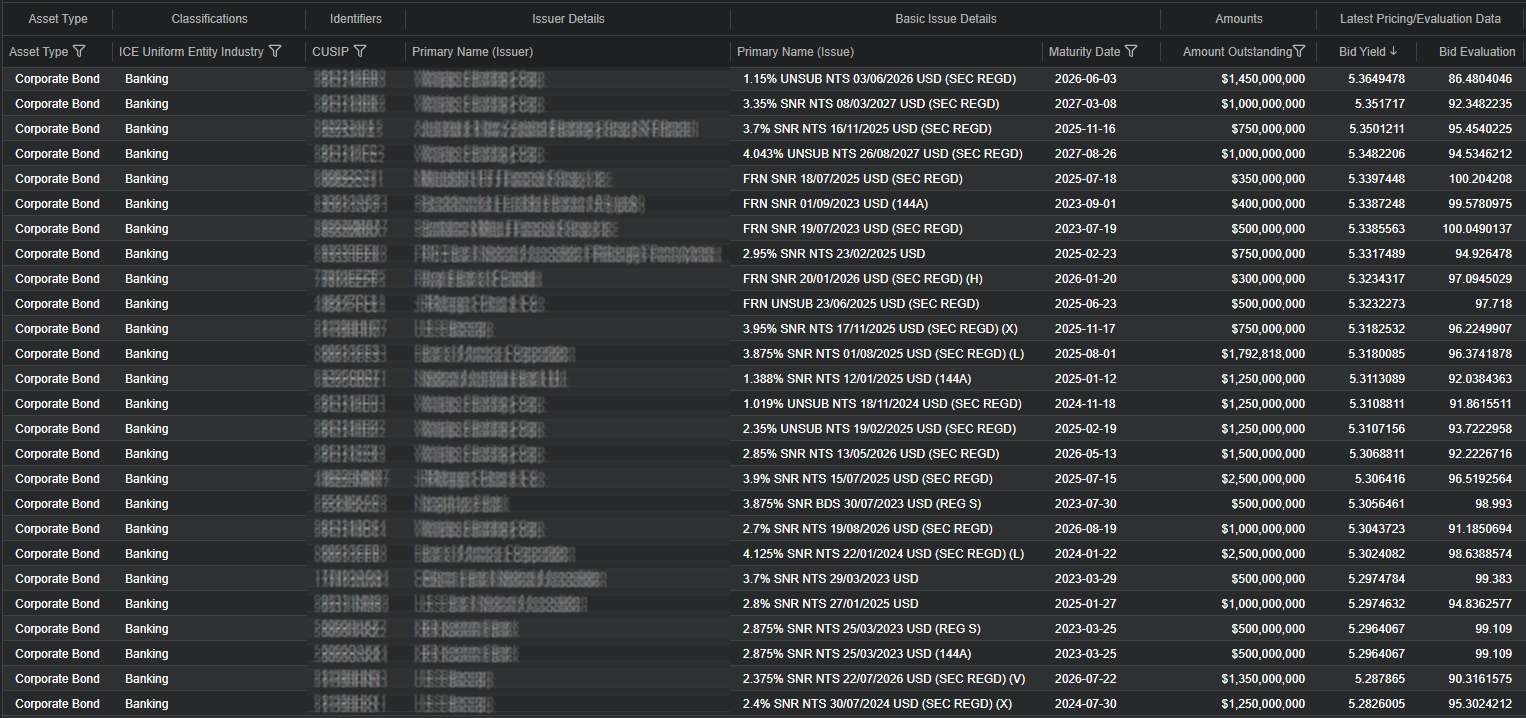
Let’s shift back to our previous scenario, where an investor is targeting corporate bonds issued by investment grade US Banks. First, we can filter for short to intermediate maturities, less than or equal to 5 years. Additionally, we will query for single A-rated issuers and exclude Subordinated paper as well as issues with less than $250 million outstanding. Despite these parameters, we must still sift through ~300 different securities. To sharpen the focus, let’s set a yield bogey of 5.5%-6.0% using ICE’s Evaluated Pricing data. Now, the list of potential investments is less than 100, still an unwieldy number. The ICE Data Viewer can provide impact bond data that helps reduce the choices considerably.
US Corporate Bonds | Banking Sector | Single A | Unsubordinated | >250M
*Click to enlarge
Source: ICE Data Services
Working with our smaller list, we can look deeper into disclosures around impact bonds including type (ie. Green, Social, Sustainable, etc.) and whether there is self-certification versus third party certification. If there is a third party, our service includes the name of the firm and the framework utilized. This level of transparency is helpful for market participants with differing opinions on the various players entering this relatively nascent business and their reputational track records.
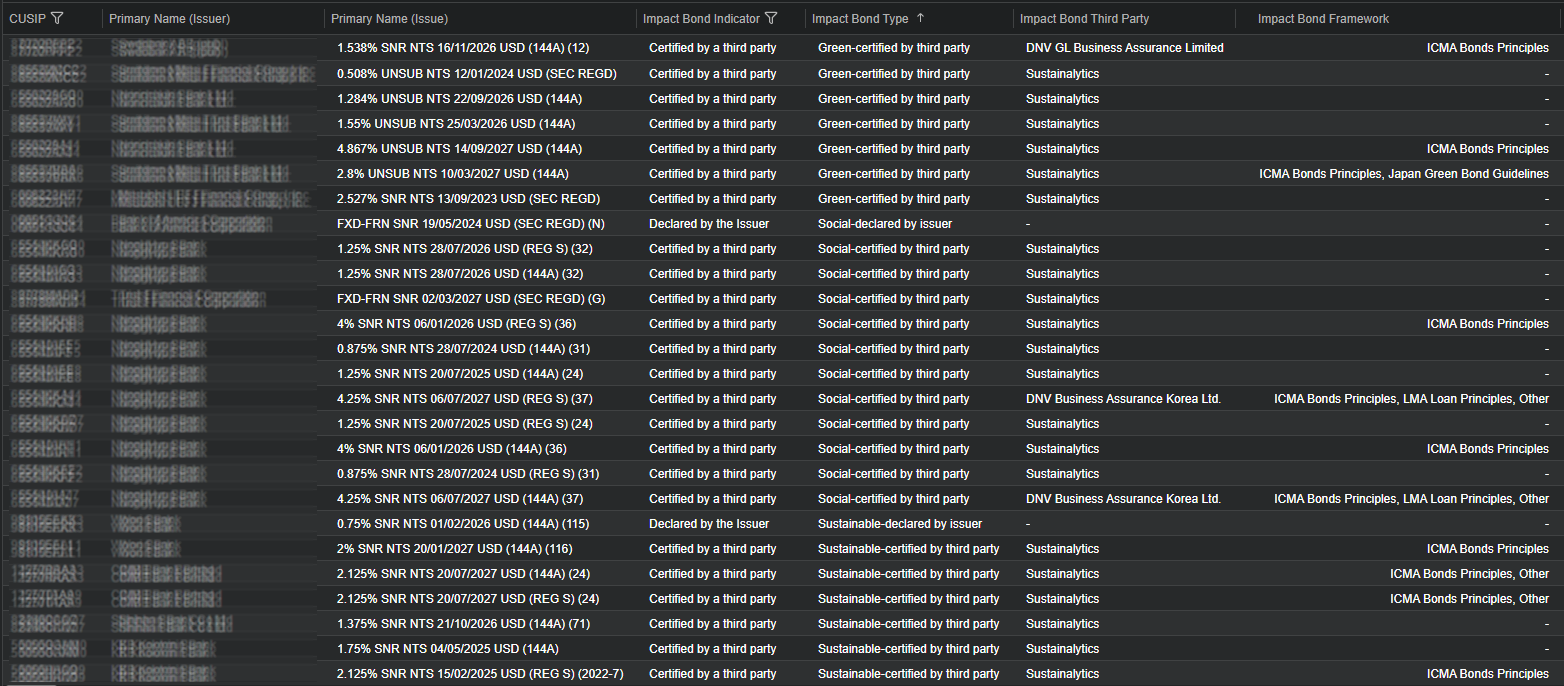
*Click to enlarge
Source: ICE Data Viewer
Beyond universe and list management functionalities, the ICE Data Viewer can drill down to the security level, with compelling data views and side by side comparisons. In our Banking sector corporate bond example, we were able to filter using impact bond criteria, and decided to pursue a Sustainable bond from the results. Interestingly, there are two choices that are returned from the same issuer, with materially similar attributes, with the exception that one is certified and the other is declared. Based on current ICE evaluated prices, we notice that in this case the certified bond is providing a slightly higher yield. Knowing this can help inform our decision-making.
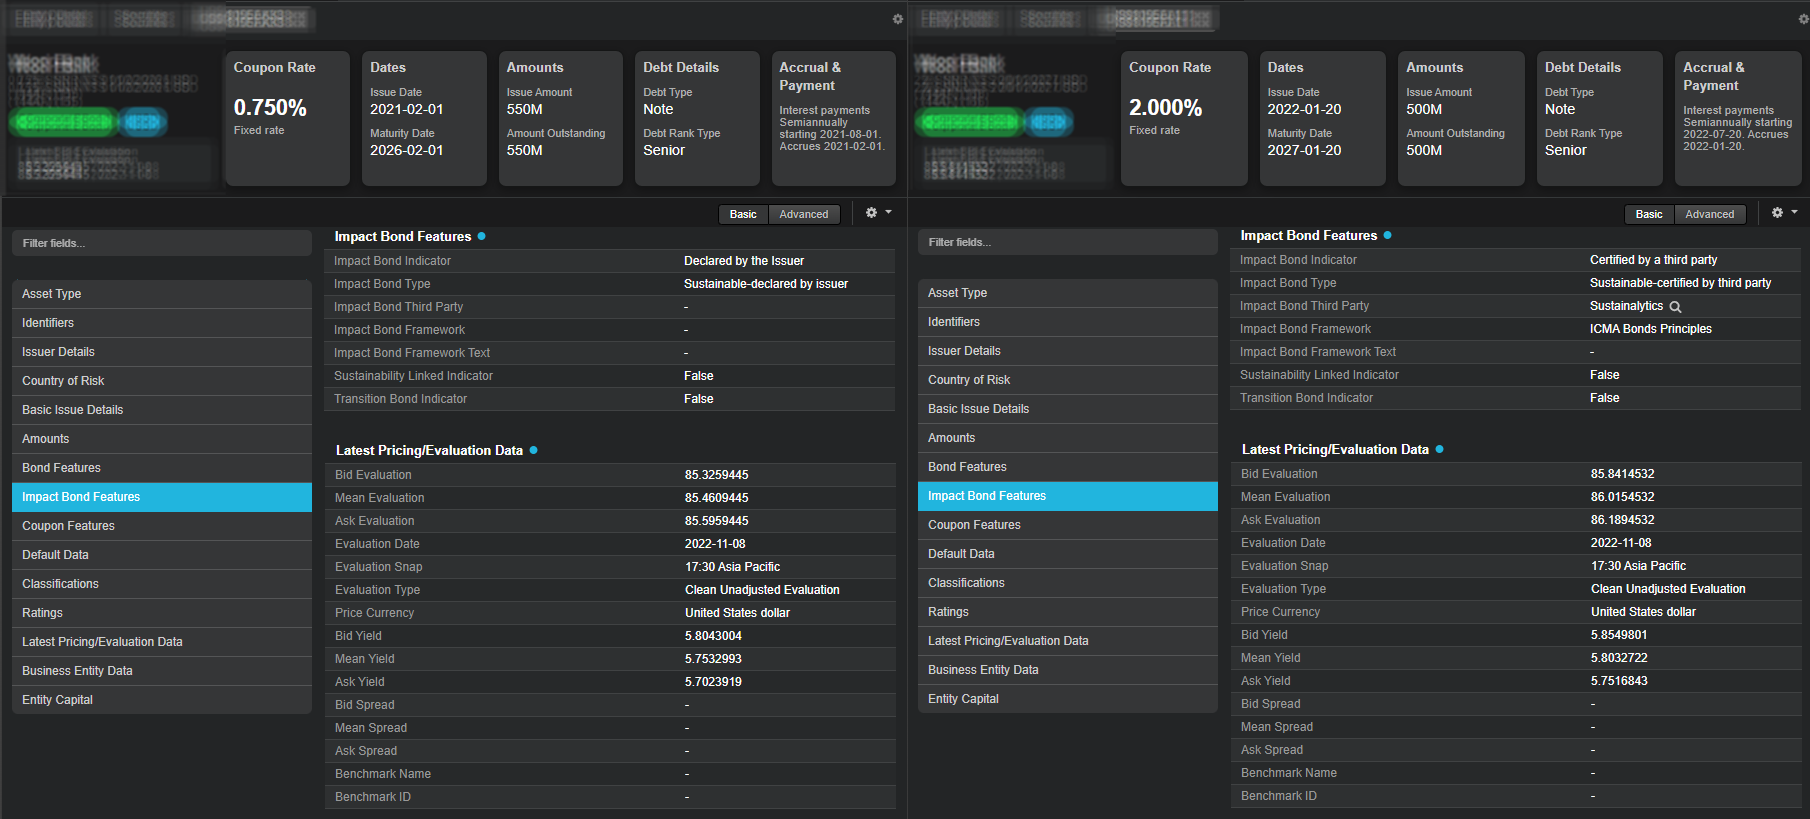
*Click to enlarge
Source: ICE Data Viewer
While ESG oriented investors are likely to care about this detail, we find that there can be compelling use cases for traditional investors as well. For example, if two bonds being considered for purchase are generally comparable, but one is classified as an impact bond a trader can choose that impact bond without straying from their investment mandate.
For fixed income participants, sorting through an influx of data to spot opportunities will be an ongoing challenge. Now, the ICE Data Viewer’s search capabilities mean finding the proverbial needle in a bond market haystack is far easier.
This document contains information that is confidential and proprietary property and/or trade secrets of ICE Data Pricing & Reference Data, LLC and/or its affiliates (“ICE”), and may not be published, reproduced, copied, disclosed, or used without the express written consent of ICE. The information contained herein is, to the knowledge of ICE, current as of the date hereof, but is subject to change, without notice. The information contained herein is for informational purposes only, does not constitute representations or warranties by ICE, and does not alter the terms of any agreements that may from time to time exist between ICE Data Pricing & Reference Data, LLC and/or its affiliates and its clients or their affiliates relating to any of the products or services described herein. This document is not an offer of advisory services and is not meant to be a solicitation, or recommendation to buy, sell or hold securities. This document represents ICE’s observations of general market movements. Trades and/or quotes for individual securities may or may not move in the same direction or to the same degree as indicated in this document. Please note that the information may have become outdated since its publication. Nothing herein is intended to constitute legal, tax, accounting, or other professional advice. Clients should consult with an attorney, tax, or accounting professional regarding any specific legal, tax or accounting situation. Trading Analytics available from ICE Data Pricing & Reference Data, LLC are a point in time output and as such dependent on and take into account the information available to ICE Data Pricing & Reference Data, LLC at the time of calculation. ICE Data Pricing & Reference Data, LLC does not have access to all relevant trade-related data or dealer quotes, and the utility of the output may diminish depending upon amount of available data underlying the analysis. The inputs utilized in each of the Trading Analytics services described herein depend on the methodologies employed by each such service and may not be the same as the inputs used in the other Trading Analytics services. There are many methodologies (including computer-based analytical modelling) available to calculate and determine information such as Trading Analytics described herein. ICE Data Pricing & Reference Data, LLC’s Trading Analytics may not generate results that correlate to actual outcomes, and/or actual behavior of the market, such as with regard to the purchase and sale of instruments. There may be errors or defects in ICE Data Pricing & Reference Data, LLC’s software, databases, or methodologies that may cause resultant data to be inappropriate for use for certain purposes or use cases, and/or within certain applications. Certain historical data may be subject to periodic updates over time due to recalibration processes, including, without limitation enhancement of ICE Data Pricing & Reference Data, LLC’s models and increased coverage of instruments. Although ICE Data Pricing & Reference Data, LLC may elect to update the data it uses from time to time, it has no obligation to do so. Fixed income evaluations, continuous evaluated pricing, end-of-day evaluations, evaluated curves, model-based curves, market sentiment scores, and Fair Value Information Services related to securities are provided in the US through ICE Data Pricing & Reference Data, LLC and internationally through ICE Data Services entities in Europe and Asia Pacific.
Index products and services are provided by ICE Data Indices, LLC. Any available index returns represent past performance and are not indicative of any specific investment. The content (including any of the output derived from any analytic tools or models) is not intended to predict actual results, which may differ substantially from those reflected. Past performance is not necessarily indicative of future results.
Trademarks of Intercontinental Exchange, Inc. and/or its affiliates include: Intercontinental Exchange, ICE, ICE block design, NYSE, ICE Data Services, and New York Stock Exchange. Information regarding additional trademarks and intellectual property rights of Intercontinental Exchange, Inc. and/or its affiliates is located at www.intercontinentalexchange.com/terms-of-use. Copyright 2022, American Bankers Association. CUSIP Database provided by FactSet Research Systems Inc. All rights reserved. Other products, services, or company names mentioned herein are the property of, and may be the service mark or trademark of, their respective owners.
If you are receiving this email in error, please notify us by contacting customer support at the contact details listed in this email.
© 2022 Intercontinental Exchange, Inc.