
Managing U.S. dollar risk in uncertain times
The U.S. Dollar Index ® (USDX) closed higher for the third consecutive month of the year as demand for the U.S. Dollar continued. The USDX closed the month of March with a gain of 0.20% at 104.27.
- An unexpected rise in Nonfarm Payrolls after 275,000 new jobs were added in February, surpassing the expected 200,000 and exceeding the significantly downwardly revised January figure of 229,000. Following this news the USDX closed the day with a loss of 0.05% at 102.69.
- Core Inflation, excluding food and energy, eased to a near three-year low of 3.8% for the period 12-month ending February, although slightly above the market expectations of 3.7%. The Consumer Price Index (CPI) data released showed a higher than expected 3.2% increase in February for the 12-month period compared with 3.1% the prior month. The USDX closed the day with a gain of 0.16% at 102.93.
- The Federal Open Market Committee (FOMC) announced on March 20th its decision to hold the federal funds rate within the range of 5.25% - 5.50%, held since July 2023. The USDX closed the day at 103.05 with a loss of 0.47%.
Insights provided by

Macro Commentary
U.S. Dollar Index® Focus
SYMBOL: DX
High impact events per day
| 5 | Average Hourly Earnings & Nonfarm Payrolls |
| 10 | Consumer Price Index & FOMC Minutes |
| 11 | Producer Price Index |
| 12 | Michigan Consumer Sentiment Index |
| 15 | Retail Sales |
| 23 | S&P Global Manufacturing PMI (PREL) & S&P Global Services PMI (PREL) |
| 25 | Gross Domestic Product (GDP) Annualized Q1 (PREL) |
| 26 | Core Personal Consumption Expenditures - Price Index |
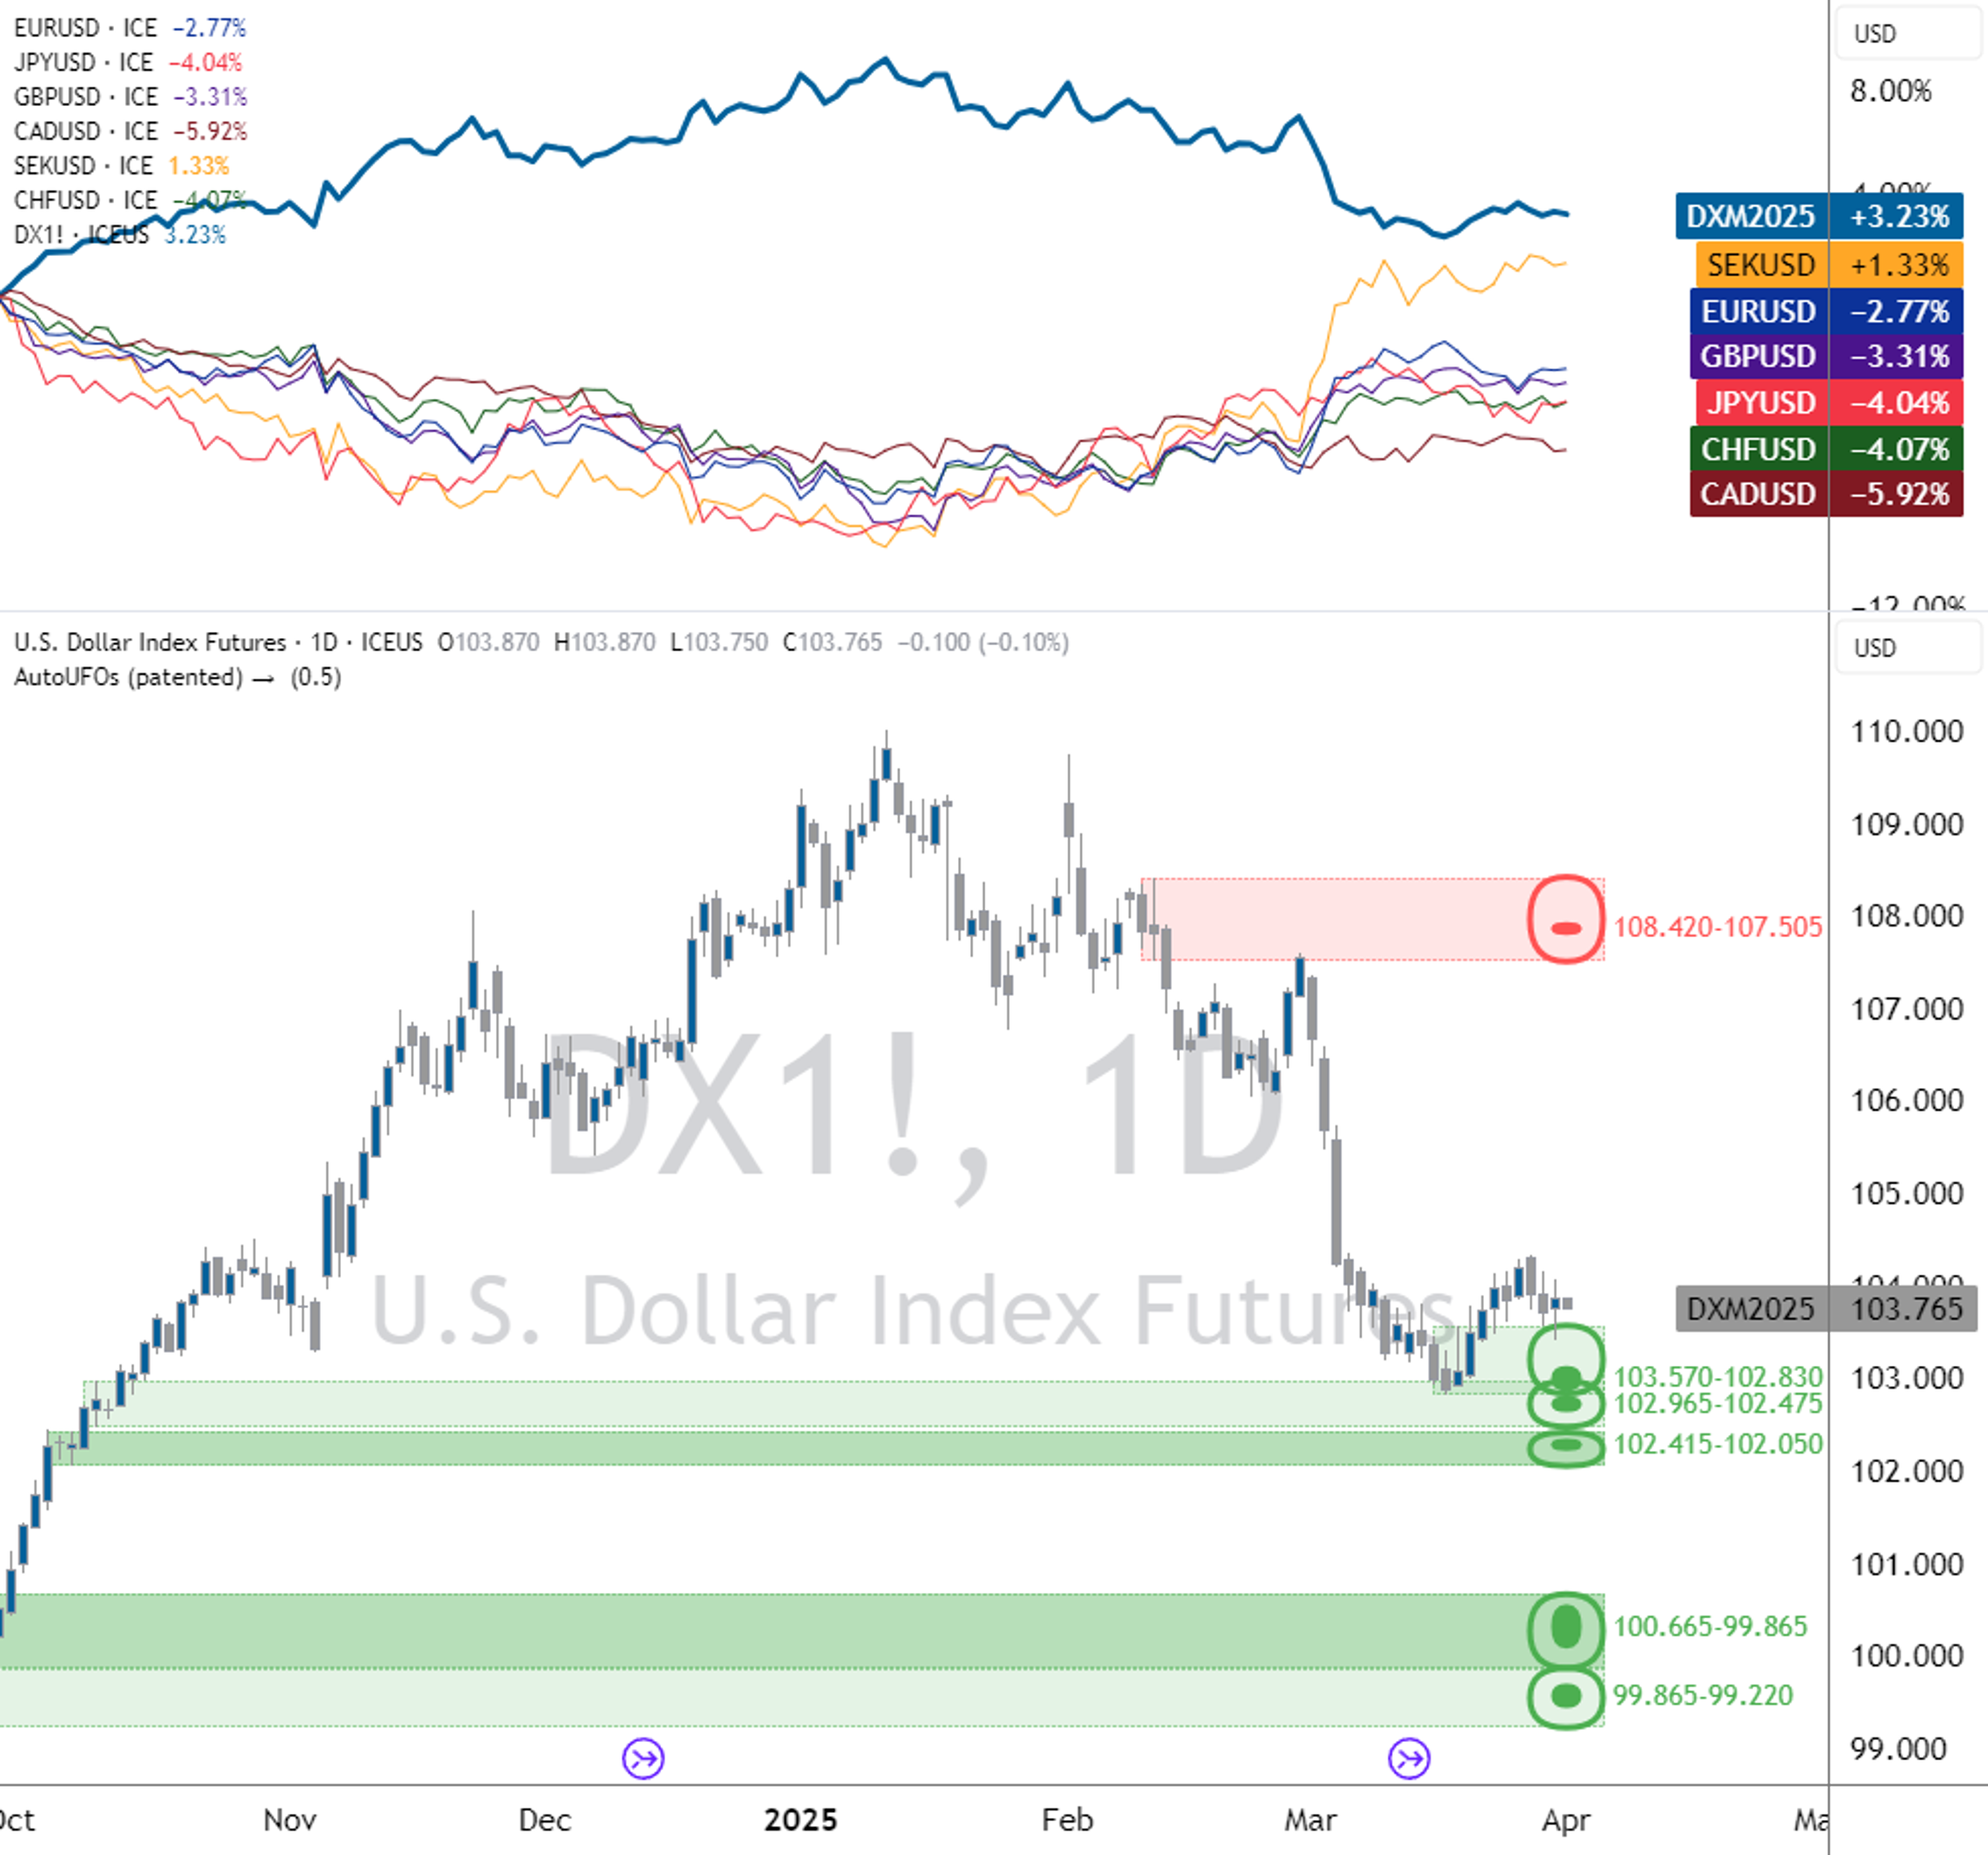
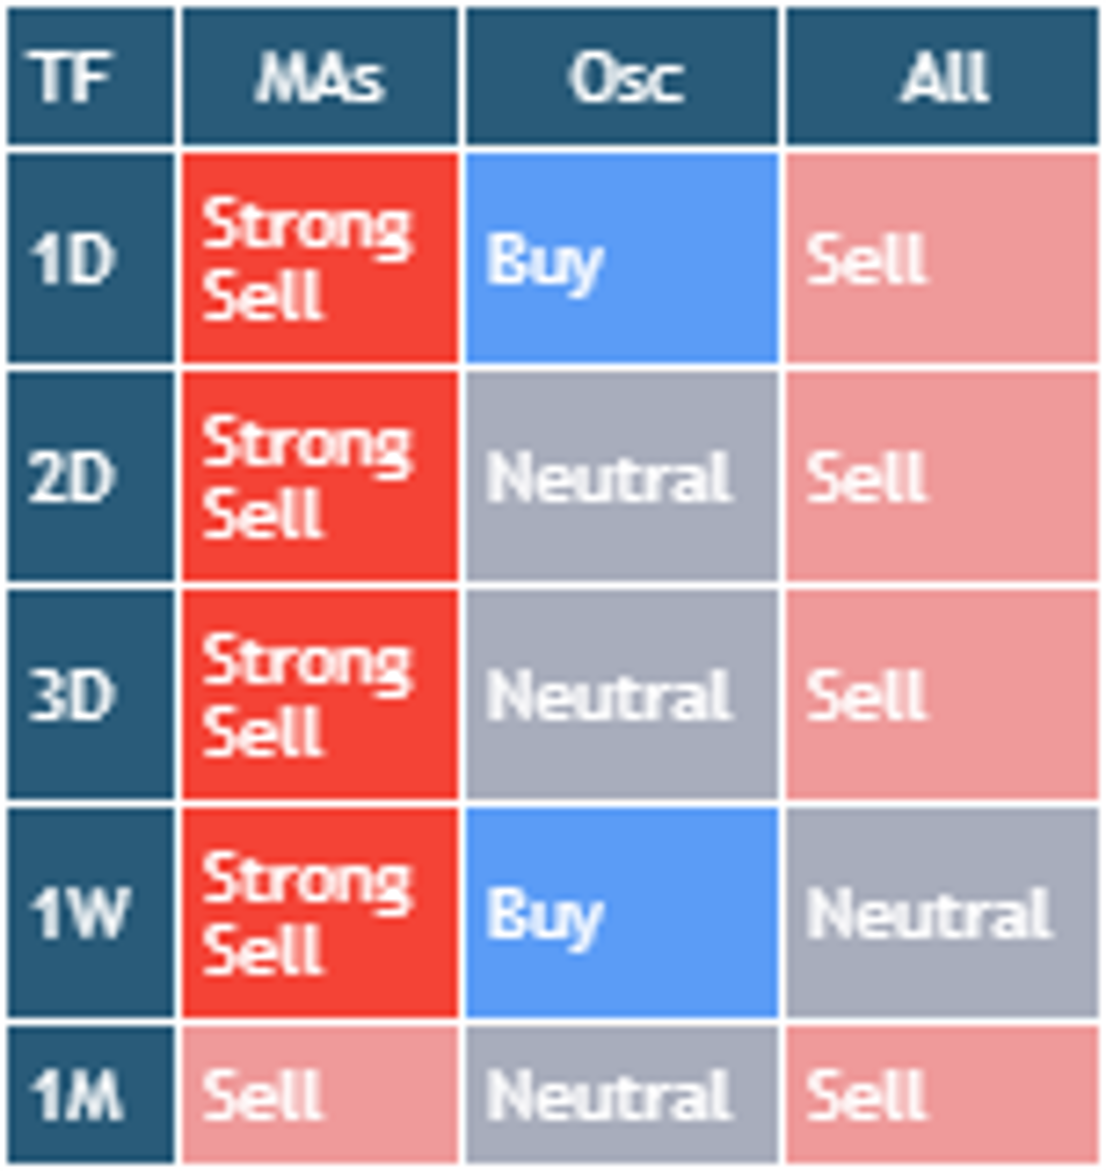
Weighting: EUR 57.6% / JPY 13.6% / GBP 11.9% / CAD 9.1% / SEK 4.2% & CHF 3.6% | Source: TradingView | Conditions Table: using daily SMA (10, 20, 30,50, 100, 200), EMA (10, 20, 30,50, 100, 200), Ichimoku Cloud (9, 26, 52), VWMA (20), HullMA (9), RSI (14), Stochastic (14, 3, 3), CCI (20), ADX (14, 14), Awesome Oscillator, Momentum (10), MACD (12, 26, 9), Stochastic RSI (3, 3, 14, 14), Williams %R (14), Bulls and Bears Power and Ultimate Oscillator (7,14,28) | Support & Resistance Levels: using AutoUFOs® (0.5) applied to a daily timeframe (plotted as dotted lines that represent relevant support and resistance price zones colored as follows: red = resistance levels & green = support levels)
After reaching a high of 104.24, the U.S. Dollar Index ® closed lower on the first day of trading, to record a loss of 0.25% after the release of worse than expected ISM Manufacturing PMI data for February. The trading week ended on Friday March 1st where the U.S. Dollar Index ® closed to mark a loss of 0.09% at 103.80.
The week commencing March 4th was peppered with the release of largely disappointing economic data, especially after the recent optimism. On Tuesday March 5th, the demand for the U.S. Dollar weakened after the release of worse than expected ISM Services PMI data, down from January’s four-month high. March 6th ADP Employment Change missed expectations, falling short by 10k recording 140,000 new private sector jobs which led to a drop of 0.45% on the day, the U.S. Dollar Index ® closed at 103.32. The bearish outlook continued throughout the remainder of the week as the demand for the U.S. Dollar continued to weaken. The largest loss of the week was recorded on March 7th after Fed Chair Powell's speech which focused on the Fed’s progress towards the easing of inflation and the commitment to reach the Fed’s 2% objective. The details led to a loss of appetite for the U.S. Dollar and the U.S. Dollar Index ® crashed through the lower boundary of the daily Bollinger Bands to close at 102.77, with a loss of 0.47%. On March 8th after the release of Nonfarm Payrolls the U.S. Dollar Index ® reached a low of 102.30 which coincided with a daily support area at 102.51 - 101.77, the market rebounded as demand for the U.S. Dollar returned. Ultimately the U.S. Dollar Index ® while it recovered some of the earlier losses it closed the day with a marginal loss of 0.05% to mark a sixth consecutive lower close and a loss of 1.07% for the week.
The following week the bullish momentum gathered pace and the U.S. Dollar Index ® began to close within the lower boundary of the daily Bollinger Bands. On March 12th the demand for the U.S. Dollar strengthened during the early trading session although it pulled back after testing the daily 10 EMA coinciding around the release of Core Inflation data, excluding food and energy. Inflation softened to 3.8% for the 12-month period ending February, while slightly higher than expected, it was a drop on the prior 3.9% announced for January. However, there was an uptick in the Consumer Price Index for the same period with annual inflation (CPI for all items) recording a rate of 3.2% against the previous 3.1%. Nonetheless the U.S. Dollar Index ® closed at 102.93 with a gain of 0.16%. Weakness crept in during trading on March 13th, the lack of appetite for the U.S. Dollar led to the U.S. Dollar Index ® closing the day with a loss of 0.15% to take the prior day's gain. The strongest daily performance of the week was on March 14th, the U.S. Dollar Index ® advanced after positive data was released. Retail Sales expanded during February after January’s decline which brought welcomed news albeit shy of expectations. The Core Producer Price Index excluding food and energy surprised the markets as it remained steady at 2.0%, just above expectations. The U.S. Dollar Index ® closed at 103.34 with a 0.58% gain. The demand for the U.S. Dollar continued into Friday’s trading and the U.S. Dollar Index ® closed with a modest 0.06% gain to conclude the week with a gain of 0.34% at 103.06.
The bullish momentum continued into trading during the week of March 18th as the U.S. Dollar Index ® closed higher for the first two consecutive trading days, closing above the midpoint of the daily Bollinger Bands for the first time this month. The momentum came to a halt on March 20th following the Fed’s policy meeting, the Federal Open Market Committee announced the benchmark overnight rate would remain within the range of 5.25% - 5.50%. Alongside the decision the Fed projected up to three, quarter of a percent rate cuts would be announced later this year, these would be the first cuts since March 2020. The U.S. Dollar Index ® closed down 0.47% at 103.05. The bearish momentum reversed on March 21st partly due to an unexpected cut by the Swiss National Bank and softer approach by the Bank of England that led investors to move into the U.S. Dollar as a safe haven. In addition, the S&P Preliminary Global Services PMI data showed an unexpected decline in growth to 51.7, falling short of forecasts and the prior release. However, the S&P Preliminary Global Manufacturing PMI data announced an unexpected improvement in manufacturing conditions, exceeding market forecasts after it moved to 52.5 from 52.2 the prior month. The U.S. Dollar Index ® boosted by the day's news rallied back through the midpoint of the daily Bollinger Bands to close with a gain of 0.72%, the top performing day of the month. The week ended on a positive note as the U.S. Dollar Index ® headed higher during Friday's trading and closed the week at 104.18 with a gain of 1.08%.
On Monday March 25th the U.S. Dollar Index ® traded lower after almost reaching the prior week's high to close at 103.93 with a loss of 0.22%. The U.S. Dollar bears drove the market lower during trading on March 26th until demand returned after the U.S. Dollar Index ® reached a pocket of support at 104.00 -103.92 on an intraday timeframe where the buyers stepped and drove prices higher for the next two trading days. On March 28th after the release of the GDP Annualized Q4 report data pointed to a 3.4% growth rate, up on the prior month's forecast of 3.2%, the U.S. Dollar Index ® closed the day with a gain of 0.13%. On March 29th there was no trading in the U.S. Dollar Index ® due to the Good Friday holiday.
The U.S. Dollar Index ® closed the month at 104.27 with a gain of 0.20%, the third consecutive positive close for the year.
The U.S. Dollar Index ® on the daily timeframe using the SMA (10 and 20) and EMA (10 and 20) reverted into an uptrend towards the end of March. The U.S. Dollar Index ® was also in an uptrend on the weekly timeframe based on the short term weekly SMA (10, and 20) and weekly EMA (10 and 20) although the moving averages were threading when you go out to a larger period.
Source: ICE Connect
USDX® Performance
Spot Rates | TICKER | 1-Mar-24 | 29-Mar-24 | Monthly Change* |
|---|---|---|---|---|
| USD/EUR | EUR A0-FX | 1.08368 | 1.079 | -0.434% |
| JPY/USD | JPY A0-FX | 150.064 | 151.303 | -0.819% |
| USD/GBP | GBP A0-FX | 1.2653 | 1.2623 | -0.238% |
| CAD/USD | CAD A0-FX | 1.35573 | 1.3537 | 0.150% |
| SEK/USD | SEK A0-FX | 10.31843 | 10.66742 | -3.272% |
| CHF/USD | CHF A0-FX | 0.8833 | 0.901 | -1.964% |
| US Dollar Index | DX A0 | 103.861 | 104.546 | 0.655% |
| Front Month | Ticker | 1-Mar-24 | 29-Mar-24 | Monthly Change |
|---|---|---|---|---|
| Mini USDX | SDX-ICS | 103.799 | 104.269 | 0.451% |
OTHER CONTRACTS | TICKER | 1-Mar-24 | 29-Mar-24 | Monthly Change |
|---|---|---|---|---|
| Brent Crude | BM-ICS | 83.55 | 87.48 | 4.492% |
| MSCI World Index | MWL | 3370.6 | 3468.8 | 2.831% |
| MSCI Emerging Markets Index | MME | 1029.4 | 1049 | 1.868% |
Mini US Dollar/Offshore Renminbi | CHM-ICS | 7.2075 | 7.2578 | -0.693% |
Source: ICE Connect
Disclosure Section
This document does not provide individually tailored financial or investment advice, and no part of this document should be construed as doing so. This document has been prepared without regard to the individual financial or other circumstances and objectives of persons who receive it. Investors and users should independently evaluate particular products, investments, and strategies and are encouraged to seek the advice of a financial advisor. The appropriateness of a particular product, investment or strategy will depend on a user or investor's individual circumstances and objectives. The products, investments or strategies discussed in this document may not be suitable for all users and investors, and certain users or investors may not be eligible to purchase or participate in some or all of them.
ICE Futures Singapore does not provide financial, investment, legal or tax advice and is not in the business of doing so. Each user or investor should always consult a financial, investment, legal or tax advisor for information concerning its individual situation and to learn about any potential financial, investment, legal, tax or other implications that may result from any product, investment or strategy described in this document.
In particular, any opinion contained in this document (including an indication of any “sell”, “neutral” or “buy” condition) is generic and not a recommendation to take (or omit to take) any action in relation to any product, investment or strategy.
Key Information Documents for certain products covered by the EU Packaged Retail and Insurance-based Investment Products Regulation can be accessed on the relevant exchange website under the heading “Key information Documents (KIDS)”.
© 2023 Intercontinental Exchange, Inc. The information and materials contained in this document - including text, graphics, links or other items - are provided for general information only on an "as is" and "as available" basis. Although this document is issued in good faith, no representation, warranty or guarantee, whether express or implied, is or will be made in respect of the information contained herein. ICE excludes all liability arising from or in relation to the accuracy, adequacy, completeness, fitness or timeliness of the information provided and assumes no duty whatsoever. The information in this document is liable to change, and ICE undertakes no duty to update such information. You should not rely on any information contained in this document without first checking that it is correct and up to date. No information set out or referred to in this document shall form the basis of any contract. The content of this document is proprietary to ICE in every respect and is protected by copyright. No part of this material may be copied, photocopied or duplicated in any form by any means or redistributed without the prior written consent of ICE. All third-party trademarks are owned by their respective owners and are used with permission.
Trademarks of ICE and/or its affiliates include Intercontinental Exchange, ICE, ICE block design, NYSE, and New York Stock Exchange. Information regarding additional trademarks and intellectual property rights of Intercontinental Exchange, Inc. and/or its affiliates is located at www.intercontinentalexchange.com/terms-of-use